


Introduction
Fever is defined as a manifestation of cytokine release in response to a variety of stimuli [1–3]. Cytokines that induce febrile responses in the human body can be released by tissue trauma, bacterial endotoxins, or exotoxins. According to several articles on postoperative fever [4,5], the degree of the febrile response seems to be correlated with the intensity of the trauma. However, distinguishing a fever caused by infection from the necessary febrile response in injured patients remains difficult because trauma patients often have concomitant obvious infectious origins, such as intra-abdominal hollow viscus injury or perforation. In this study, we aimed to demonstrate and clarify the following hypotheses: (1) the fever in trauma patients might be correlated with injury severity; (2) the fever, which develops immediately after injury, might not have implications for the clinical outcomes; and (3) in severely injured patients, the absence of the early febrile response might indicate poor prognosis.
Materials and Methods
This was retrospective observational study. The medical records of trauma patients who were admitted to our surgical intensive care unit (ICU) and received final treatment in this hospital without transfer to other centers between January 2015 and December 2017 were collected and analyzed. The exclusion criteria were as follows: (1) patients with traumatic brain injury (TBI); (2) patients who were transferred from other hospitals to this hospital for further treatment; and (3) patients who received antipyretics within 4 days of admission to the ICU for the treatment of complications caused by fever because some patients received antipyretics during their body temperature was increasing. All injured patients were initially evaluated by our acute care surgical team in the emergency center, and underwent resuscitation, which included blood transfusion, crystalloid restriction, immediate diagnostic workup, and surgery as soon as possible. The injury severity score (ISS), based on the anatomical scoring system, hemodynamic parameters, laboratory variables, and body temperature (BT), was immediately recorded. The BT was checked regularly at patients’ tympanic membranes at intervals of at least 2 hours, and the higher temperature was recorded if the measurements of both tympanic membranes revealed discordance. This protocol continued until the patients were transferred from the ICU to the general ward. We did not use antipyretics and did not perform any diagnostic work-up for the increased BT within 4 days of admission unless the patients exhibited serious physiologic stress or discomfort and metabolic demands of fever and shivering.
We classified the patients into three groups according to their maximal BT within 4 days of admission: (1) Group A, BT < 37°C; (2) Group B, 37°C ≤ BT ≤ 38°C; and (3) Group C, BT > 38°C. We investigated and compared the following clinical and laboratory variables according to the patient groups: mortality, length of ICU stay, length of hospital stay, ISS, mechanical ventilation or not, vasopressor treatment or not, white blood cell (WBC) count, level of c-reactive protein (CRP), level of lactate, amount of red blood cell (RBC) transfusion, surgery or not, and intraperitoneal contamination or not. In addition, we analyzed the differences between surviving and deceased patients to identify any factors affecting mortality in the trauma patients. Finally, we selected subgroup patients who received vasopressor treatment to identify any correlation of BT with mortality in severely injured patients.
1. Statistical analysis
The normality assumption was not satisfied with the Kolmogorov-Smirnov test for most of the variables; therefore, nonparametric statistical methods were applied. The summary statistics are presented as numbers and percentages for categorical variables and as medians (interquartile range) for continuous variables. In the analysis of more than two groups, p values were calculated using the Cochran-Armitage trend test for categorical variables and the Kruskal-Wallis test for continuous variables. In the analysis of two groups, the chi-square or Fisher’s exact test was used to compare categorical variables, and the Wilcoxon rank sum test was used to compare continuous variables. We considered a two-sided P < 0.05 to indicate statistical significance. We made a two-dimensional scatterplot in which variables included the ISS and BT of each patient and applied the locally weighted scatterplot smoothing (LOESS) method to graphically visualize the relationship between the BT and ISS. All statistical analyses were performed using the software package SAS 9.4 (SAS Institute, Inc., Cary, NC).
Results
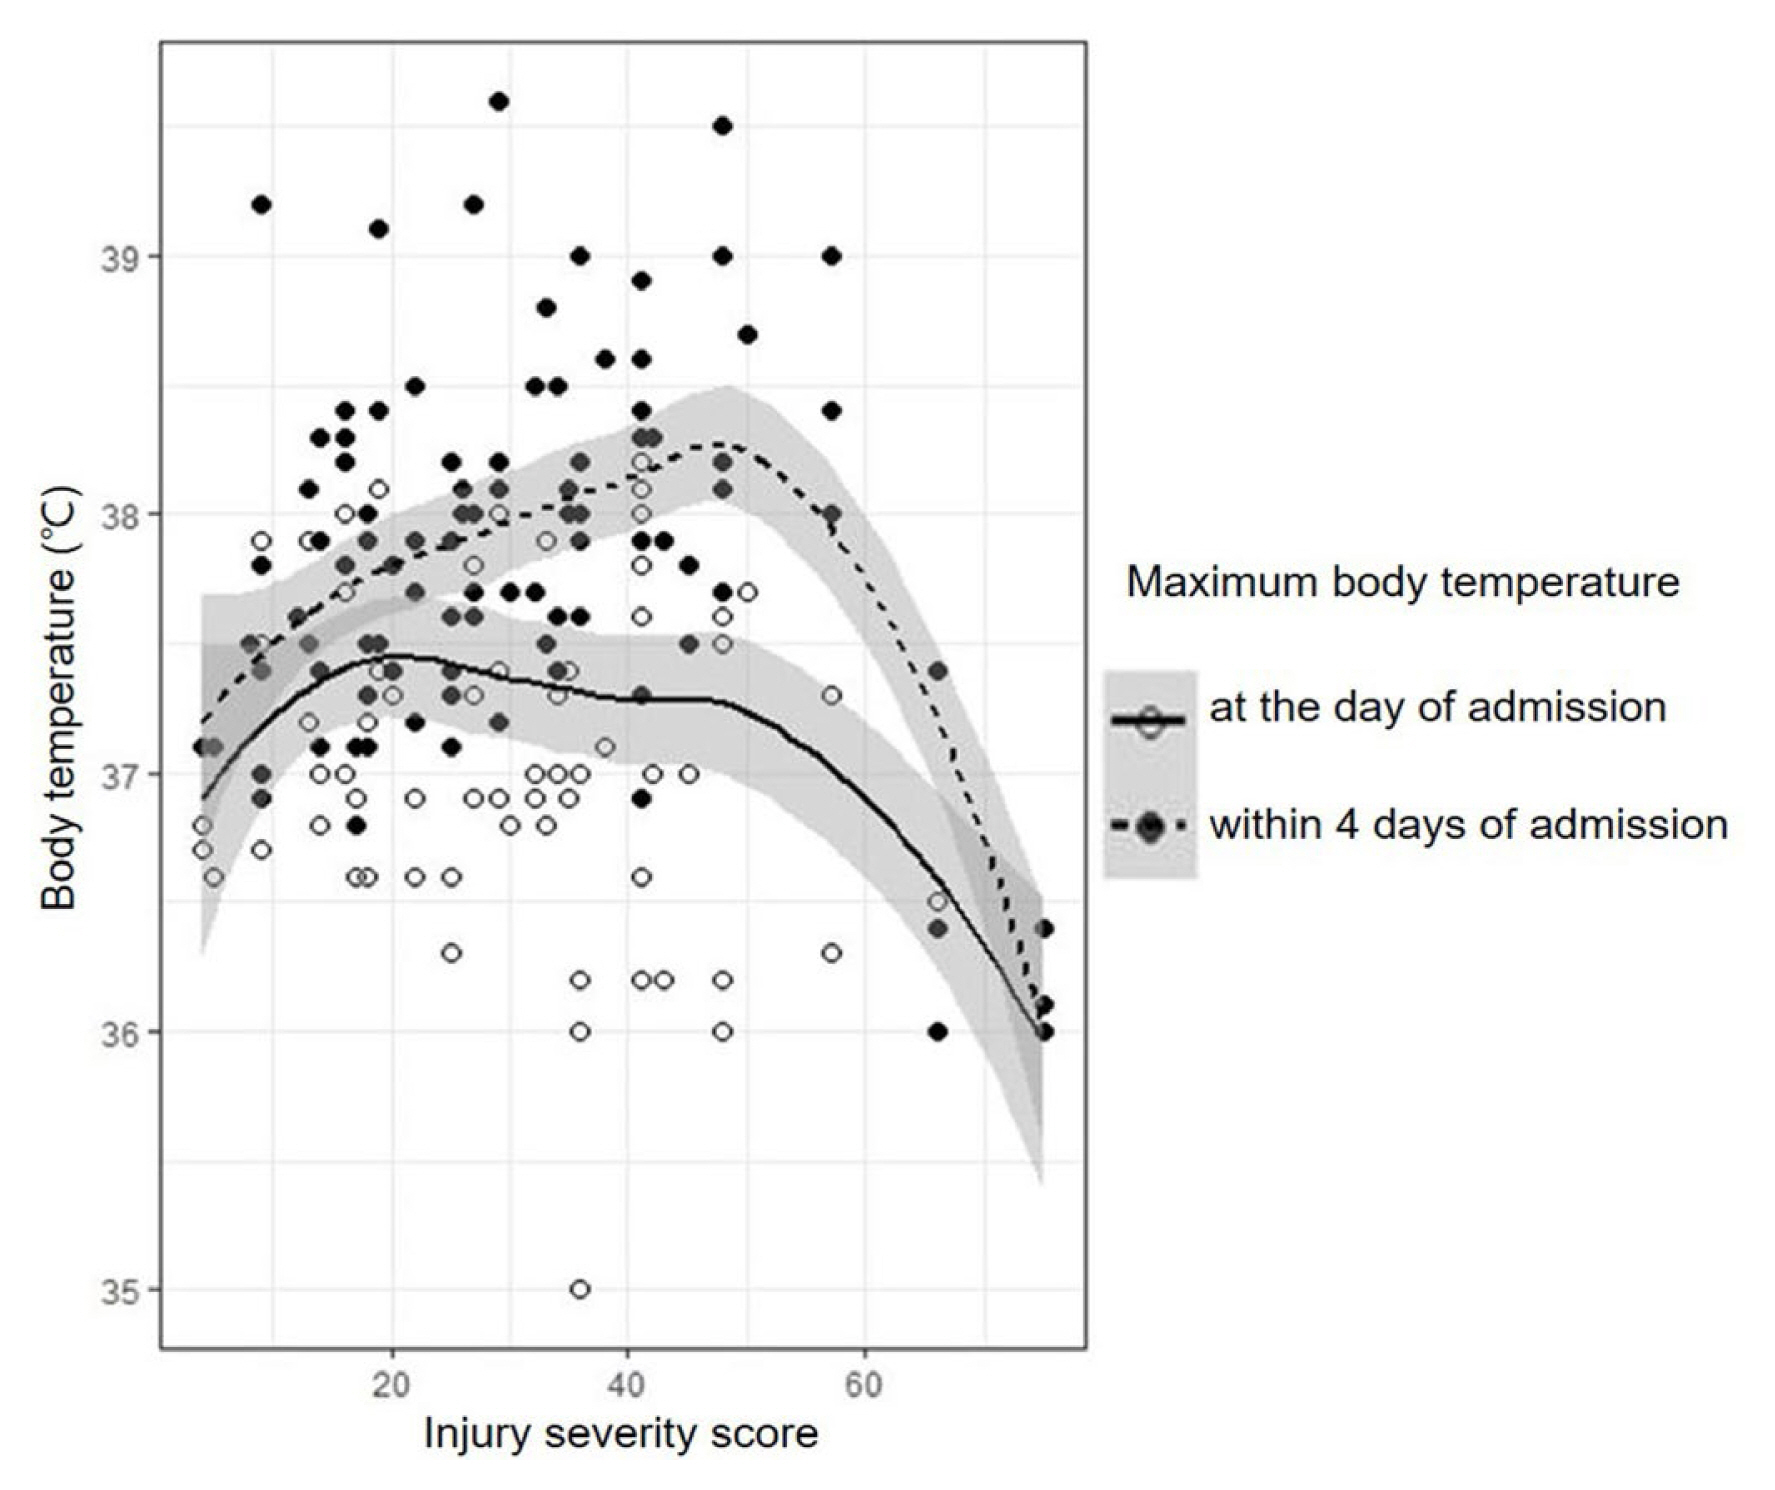
A total of 111 patients were included in this study. Figure 1 illustrates the LOESS from the scatterplot of BT and ISS, which visualizes the correlation of BT with ISS in the entire cohort. The dotted line with black points represents the correlation of peak BT within 4 days of admission with ISS, and the solid line with empty points represents the correlation of peak BT on the day of admission with ISS. With this graph, we could grossly estimate that peak BT within 4 days of admission increased as the ISS increased to a certain point, above which it decreased. The turning point was calculated as an ISS of 47.717. Comparatively, the peak BT on the day of admission showed a relative tendency to decrease as the ISS increased.
The clinical and laboratory differences between the patient groups are described in Table 1: 11 patients were included in the group A; 58 in the group B; and 42 in the group C. ISS and initial lactate levels were significantly different between the patient groups (p < 0.001 and p = 0.003, respectively): 1) the mean ISS was 66 in group A, 25 in group B, and 35.5 in group C; 2) the lactate levels were 7.7 mmol/L in group A, 3.0 in group B, and 3.8 in group C. The mortality was significantly higher in group A than in the other groups (72.7%; p < 0.001); however, few differences were found between groups B and C (3.5% and 2.4%, respectively). Group C patients were hospitalized for more days in both the ICU and general ward and exhibited higher levels of WBC and CRP than group A and B patients. On average, 16 units of RBC per patient were transfused in group A, 6.5 in group C, and 0 in group B (p < 0.001). Furthermore, no differences in the frequency of operation, intraperitoneal contamination, mechanical ventilation, and vasoactive drug infusion were observed between the groups.
Table 2 demonstrates the differences between surviving and deceased patients. The deceased patients had significantly lower BT on the 1st and 2nd days after admission (36 °C and 36.9 °C) than the surviving patients (37.3 °C and 37.7 °C; p < 0.001 and p = 0.006). In addition, the ISS, initial lactate level, and incidence of ventilator and vasoactive drug treatment were higher in the deceased group than in the surviving group. The deceased patients received more RBC transfusions than the surviving patients, and the survivors were hospitalized for more days than the nonsurvivors. In the analysis of severely injured patients who received vasopressors or inotropic treatment (Table 3), a high ISS point, low WBC count on the 4th day after admission, low level of CRP on the 2nd, 3rd, and 4th days after admission, large amount of transfused RBCs, and low BT on the 1st to 4th days after admission were significantly correlated with mortality. The hospital and ICU length of stay were longer in the surviving patients than in the deceased patients.
Discussion
The results of this study strongly supported our hypotheses that early fever in trauma patients without brain injury is correlated with injury severity but not with prognosis. Rather, hypothermia on the 1st and 2nd days after admission was significantly correlated with mortality, and the hypothermic patient group had a higher mortality rate than the other patients. In severely injured patients, we carefully suggest that the decreased inflammatory response might play a certain role in promoting a high mortality rate, as we could observe that hypothermia on the 1st to 4th days following admission, along with a low level of inflammatory biomarkers, such as CRP and WBC, were correlated with mortality in the subgroup analysis of patients who received vasoactive drug treatment.
The methodology of this study is acceptable, though it is different from that in previous works. First, we noticed that the previous studies mainly included only TBI patients or all trauma patients, including TBI. In our study, therefore, we excluded TBI patients to reduce the confounding bias, as the fever in TBI might be caused by a change in the thermoregulatory hypothalamic set point due to direct neuronal damage [6]. Early fever after TBI has been regarded as the secondary insult to brain structures [7], and a recent large prospective study revealed that fever might be associated with worse clinical outcomes and mortality in TBI [8], though the results seem to be conflicting [9]. However, we empirically speculated from our clinical experiences that early fever did not worsen clinical outcomes in non-TBI patients; therefore, we set a hypothesis contrary to the established data acquired from TBI patients. The patients included in this study could represent non-TBI and major trauma patients because only patients who required surgical ICU admission were included. In addition, we investigated BT within 4 days of ICU admission because new or persistent fever > 4 days after surgery might indicate a persistent infectious source or new complications, though fever may last ≥ 72 hours postoperatively even in patients who received definite surgical source control and timely antibiotic treatment [10]. Since the BT varies according to gender, age, measurement methods, site, and time, defining normal BT is difficult [11]. In our study, we applied the recommendations of the American College of Critical Care Medicine guidelines published in 2008 [10]: 1) fever is defined as a temperature elevation >38°C for >1 hour; 2) normal BT is generally considered to be 37°C; and 3) tympanic membrane BT via infrared ear thermometry is an acceptable method of measuring core BT. Finally, we used LOESS to demonstrate any correlations of BT with ISS because the two-dimensional plots of BT and ISS showed no specific order, as shown in Figure 1. LOESS is a nonparametric regression that uses local weighted regression, and a smoothing parameter is calculated as a third variable in addition to the two established variables. The predictor in nonparametric regression analysis does not take a predetermined form but is constructed according to information derived from the data. While LOESS requires large, densely sampled data sets and cannot produce a regression function that is easily represented by a mathematical formula, it can be used as a simple strategy for fitting smooth curves to empirical data [12].
Fever can be a hallmark of systemic infection or surgical complications, and generating a fever is a metabolically costly process, requiring an 11–13% increase in oxygen consumption to elevate 1°C in body temperature [13]. Therefore, surgeons tend to be nervous when their patients become febrile and try to find any possible infectious source. Comparatively, in 1942, Cuthbertson first described that the metabolic responses after an injury could be classified into two phases: the ebb and flow phases [14]. In this model, fever is a physiologic reaction of the increased metabolic rate in the flow phase, which is a period of convalescence; therefore, fever can be accepted as an essential and common event after injury. The pathophysiologic implication of fever remains unclear. In critically ill patients, fever ≥ 39.5°C was associated with increased mortality [15]. In contrast, fever can be an adaptive response to infection, and elevated peak BT in ICU patients with infections was correlated with decreased mortality [16]. In our study, we considered mechanical ventilation and intraperitoneal contamination as the possible infectious causes of early fever in surgical ICU patients with trauma; however, the results revealed no differences between patient groups, suggesting that the early fever in trauma might not be caused by infection. Catheter-related infection and surgical site infection were not included because of their late-onset characteristics. The mortality, ISS, and lactate levels were higher in group A than in groups B and C, and these variables were higher in group C than in group B. These findings were consistent with Figure 1, which illustrates that peak BT within 4 days of admission increased as the ISS increased to a certain point, above which it decreased. In severely injured patients, the peak BT of the survivors was 37.3°C on the 1st day, 38°C on the 2nd day, 38.1°C on the 3rd day, and 37.9°C on the 4th day, which can be considered as fever.
First, since few cases resulted in mortality (N = 10), we could not perform multivariate analysis to demonstrate the correlation of BT with mortality. Second, this study was a retrospective observational study; therefore, a microbial culture test and other inflammatory biomarkers, such as procalcitonin, were not included, which would be helpful in identifying the relationship between BT and established infection. Third, the decreasing BT in severely injured patients might be for the high injury severity or for the aggressive resuscitation. However, it was difficult to exclude the effect of resuscitation because the amount of resuscitation tends to be always increased as ISS increase. It was also difficult to analyze the initial BT because the records often were discordant for the issue of heterogeneity in environment, transport system, and prehospital management. Finally, LOESS could not generate a scientific formula that can definitely explain the correlation of BT with ISS, showing only an approximate relationship. However, the studies that report the clinical implication of fever in non-TBI trauma patients are rare, and we expect that this study would be helpful in promoting further well-designed prospective randomized trials.
Conclusion
Early fever after injury was correlated with ISS but not with prognosis. In severely injured patients, the absence of the febrile response might indicate poor prognosis. Surgeons may wait and see what happens without unnecessary intervention when they encounter unpredicted febrile responses during the early period of trauma management, though the injured patients often have concomitant obvious infectious origins, such as peritonitis. Rather, hypothermia might be a surrogate for profound injury, and surgeons should prepare for clinical deterioration.