Visualizing Frailty: Exploring Radiographical Measures of Frailty in Trauma Patients
Article information

Abstract
Purpose
This study assessed the relationship of core muscle sarcopenia, myosteatosis, and L1 attenuation to the 5-factor modified frailty index (mFI-5), discharge disposition, and post-admission complications in orthopedic and general trauma patients. It was hypothesized that reduced sarcopenia, L1 attenuation, and increased myosteatosis is associated with higher mFI-5 scores (≥ 0.3), discharge into care, and increased post-admission complications.
Methods
This prospective cohort study was performed at a Level 1 trauma center. Patients were surveyed and metrics of the mFI-5 were used. Frail was categorized as a mFI-5 score ≥ 0.3. Recent abdominal computed tomography (CT) scans were used to extract radiographical information of total psoas cross-sectional area, psoas myosteatosis, and L1 vertebrae attenuation.
Results
There were 140 patients who consented to the study, of which 83 had available abdomen and pelvis CT scans. The mean age was 43.19 (± 17.36), and 65% were male (n = 52). When comparing the frail (16%, n = 13) and not frail (84%, n = 70) patients, there was a significant difference in mean psoas myosteatosis (p < 0.0001) and the attenuation of the L1 vertebrae (p < 0.001). On multivariate analysis when accounting for age, myosteatosis of the psoas muscles was predictive of an mFI-5 score ≥ 0.3.
Conclusion
The findings suggest that myosteatosis and L1 attenuation are associated with frailty indices (mFI-5) after traumatic injury. Future studies are needed to prospectively assess the validity of both radiographical and index-based markers of frailty in predicting post-traumatic complications, mortality, and hospital utilization.
Introduction
Frailty is a syndrome of decreased physiological reserve characterized by marked vulnerability to morbidity and mortality [1–3]. Until recently, frailty had been seen as an age-related decline in health, but recent studies have shown non-geriatric trauma can also be determined by the modified frailty indices (mFI) [4]. A variable number of frailty indices have been used in trauma and non-trauma populations (5 indices [5–10], 11 indices [10–12], and 15 indices [13]), and all have been shown to predict adverse outcomes including in-hospital complications, mortality, and increased hospital utilization. A limitation of commonly used frailty assessments is that they require the extrapolation of information from a conscious patient or identified patient chart which may prove unfeasible in a trauma setting [14]. In trauma, frailty often goes unrecognized until later in the course of treatment thus, limiting the capacity of medical staff to provide early coordination of care for frailty-specific factors [15]. Therefore, a fast and straightforward tool to assess frailty which is independent of patient mental status, would be clinically useful.
Radiographical markers of frailty, including psoas atrophy [16–20] and L1 attenuation [21,22] have previously been described. Psoas atrophy is characterized by sarcopenia (or decreased muscle mass) [23–25] and myosteatosis (fatty infiltration of the muscle) [26]. Sarcopenia, measured as cross-sectional surface area (cm2) of the core psoas muscle, has been reported to predict complications in surgical transplant and cancer patient populations [27–29]. Myosteatosis, a radiodensity measure of heterogenous muscle architecture, measured in Hounsfield units (HU), has been reported to predict morbidity and mortality in pancreatic [30], metastatic [31], and liver [32] cancer patients. L1 attenuation, the radiodensity of the 1st lumbar vertebra, has been associated with aging and osteoporosis [22], and has been reported to have factors related to frailty [33–35].
The purpose of this prospective study was to answer 2 questions: (1) Is there a relationship between radiographical markers of frailty (sarcopenia, myosteatosis, and L1 attenuation) and the widely used frailty indices in trauma patients; and (2) Are radiographical markers of frailty associated with in-hospital complications, and hospital utilization by trauma patients. It was hypothesized that frailty indices were associated with radiographical markers of frailty, in-hospital complications, and adverse hospital utilization. We aim to lay the groundwork for crafting a radiographical tool for risk stratification, triage, and coordination of care for trauma patients.
Materials and Methods
1. Study design
Following approval from the institutional review board (no.: IRB00086957), this prospective cohort study recruited patients between June and July 2019 at a Level 1 trauma center. All orthopedic, and general trauma patients were screened for participation, and those who participated in the study gave informed consent. The inclusion criteria were: > 18 years of age, hospitalized due to traumatic injury to the chest/ abdomen/pelvis (CAP), received a computed tomography (CT) scan upon admission, and were not pregnancy or incarcerated.
2. Frailty indices
The trauma-specific 5-factor modified frailty index (mFI-15) score was determined directly using a patient questionnaire (when patient mental status allowed) [13]. The mFI-5 score was calculated from co-morbidity data (diabetes mellitus, hypertension, chronic obstructive pulmonary disease, congestive heart failure, and functionally dependent health status) collected from the institute trauma registry. A frailty index score greater than or equal to 0.3 was designated as frail [11].
3. Radiographical markers of frailty
Under the guidance of a fellowship-trained musculoskeletal radiologist, radiographical measurements for sarcopenia, myosteatosis, and L1 attention were measured on CT CAP scans. Measurements were obtained by analysts who were blinded to the frailty score of the patient.
Sarcopenia was defined as the total psoas in a cross-sectional area (cm2) measured at the apex of the lumbar lordotic curvature (Figure 1). The apex of the lordotic curvature was consistent with the 3rd or 4th lumbar vertebral levels (L3, L4) in all patients. The apex at L3 or L4 was first identified on the sagittal view. Subsequent cross-sectional measurements were taken around the 2 core psoas muscles in the transverse view, with the free hand region of interest tool, at the level where spinal processes of the target vertebra could be visualized. Smaller psoas cross-sectional areas are consistent with decreased muscle sizes. Myosteatosis was measured as radiodensity of the psoas in Hounsfield units (HU), also measured at the same level as the psoas cross-sectional area (Figure 1). A lower HU indicated fatty infiltration. Total psoas cross-sectional area, average HU, and standard deviation measurements were recorded for both psoas muscles.
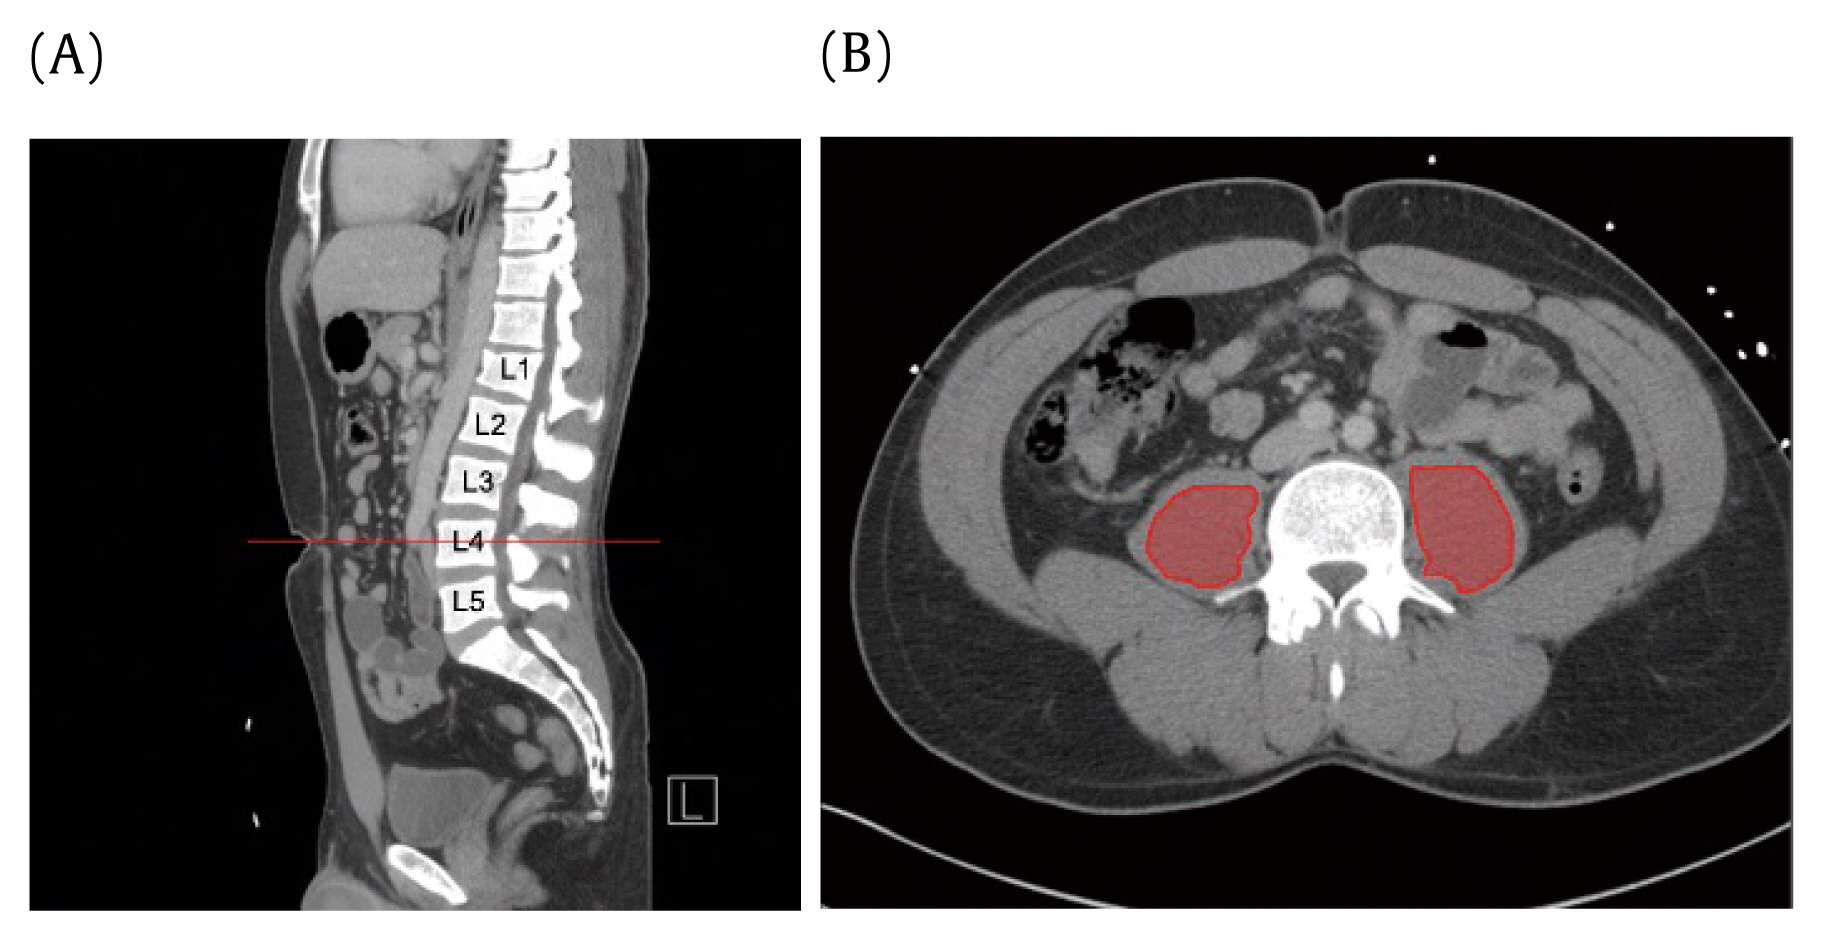
Psoas measurements. Transverse CT shows areas where myosteatotic and sarcopenic data were derived.
For L1 attenuation, the controlled site of measurement was at the superior trabecular portion of the 1st lumbar (L1) vertebra (Figure 2). The L1 vertebra was first identified on the sagittal view and the center of the vertebra was identified in transverse view with the use of a scout line. This ensured the measurements were taken at the midline of the vertebra. HU measurements were then taken with an elliptical region of interest tool, at the trabecular portion which lies superior to the mid-cortical region (Figure 2). L1 attenuation was measured in HU where a lower HU indicated lower bone density. Average HU and standard deviations were recorded.
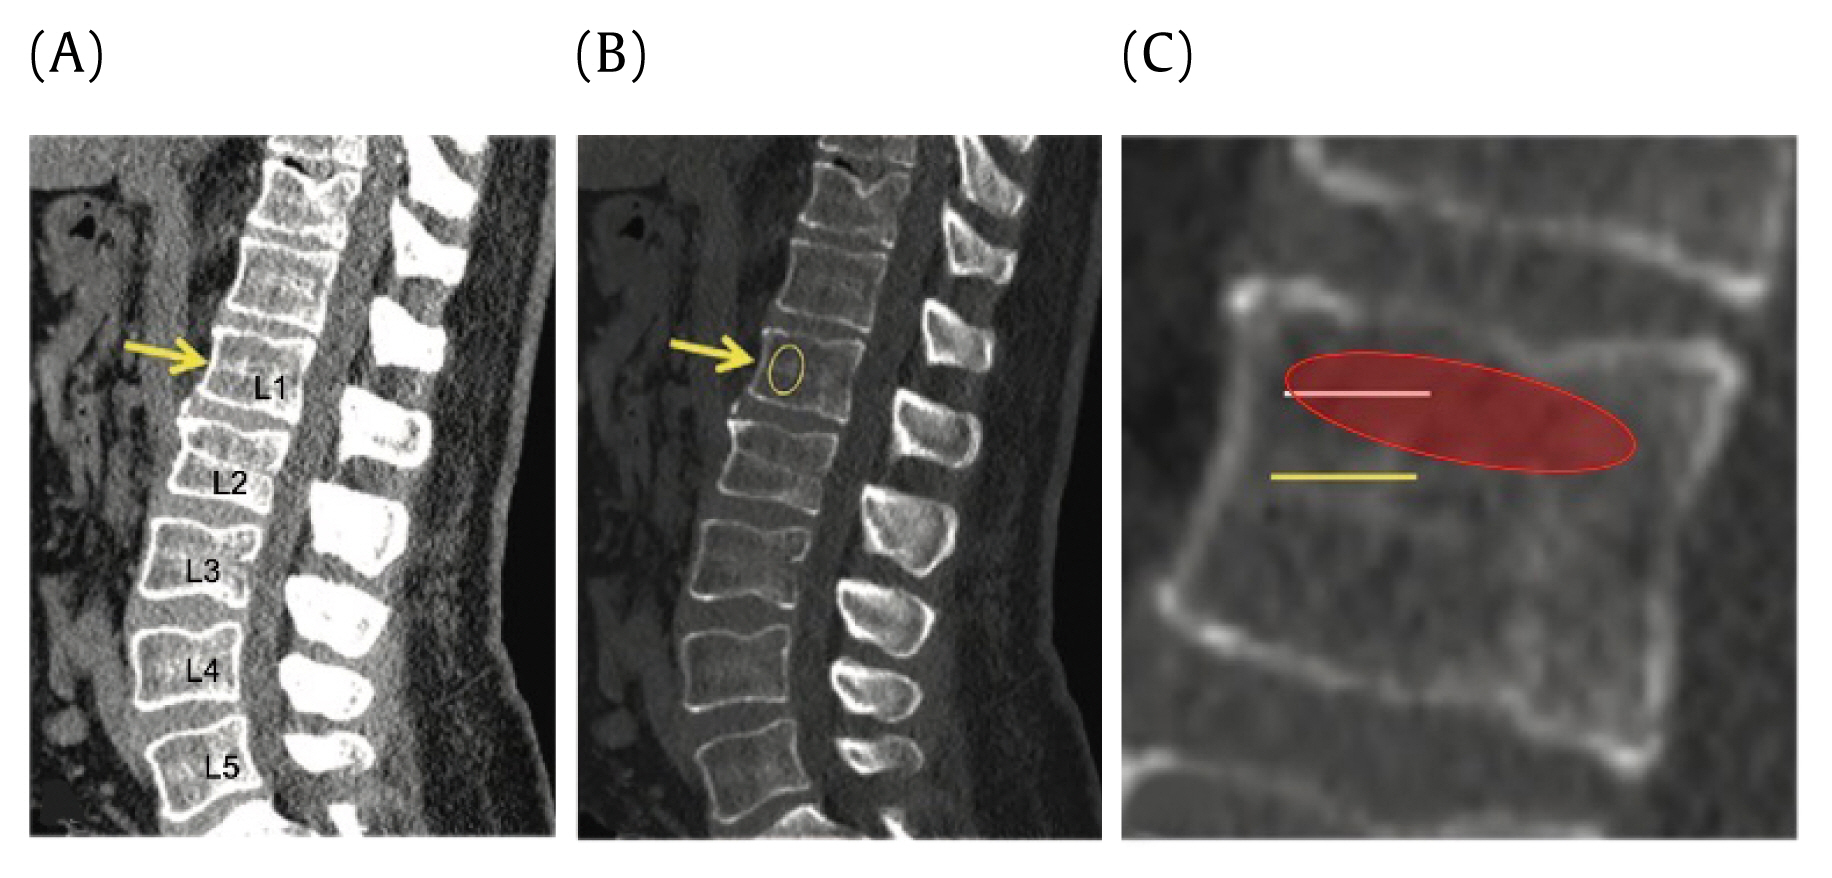
L1 attenuation. Sagittal CT shows derivation of the radiodensity of the L1 superior trabecular bone.
Patients with injury or prior surgery involving the vertebral bodies or psoas muscles between the 1st and 5th lumbar vertebra (L1–L5) were excluded from the study due to an inability to acquire consistent measurements.
The absence of contrast was recorded for all CAP CT scans. When intravenous contrast was administered, the phase (arterial vs. portal venous) of contrast was reported. A subset analysis including patients with only contrast CT scans was conducted in an effort to account for the radiodensity discrepancies between contrast and non-contrast CT scans (Figure 3).
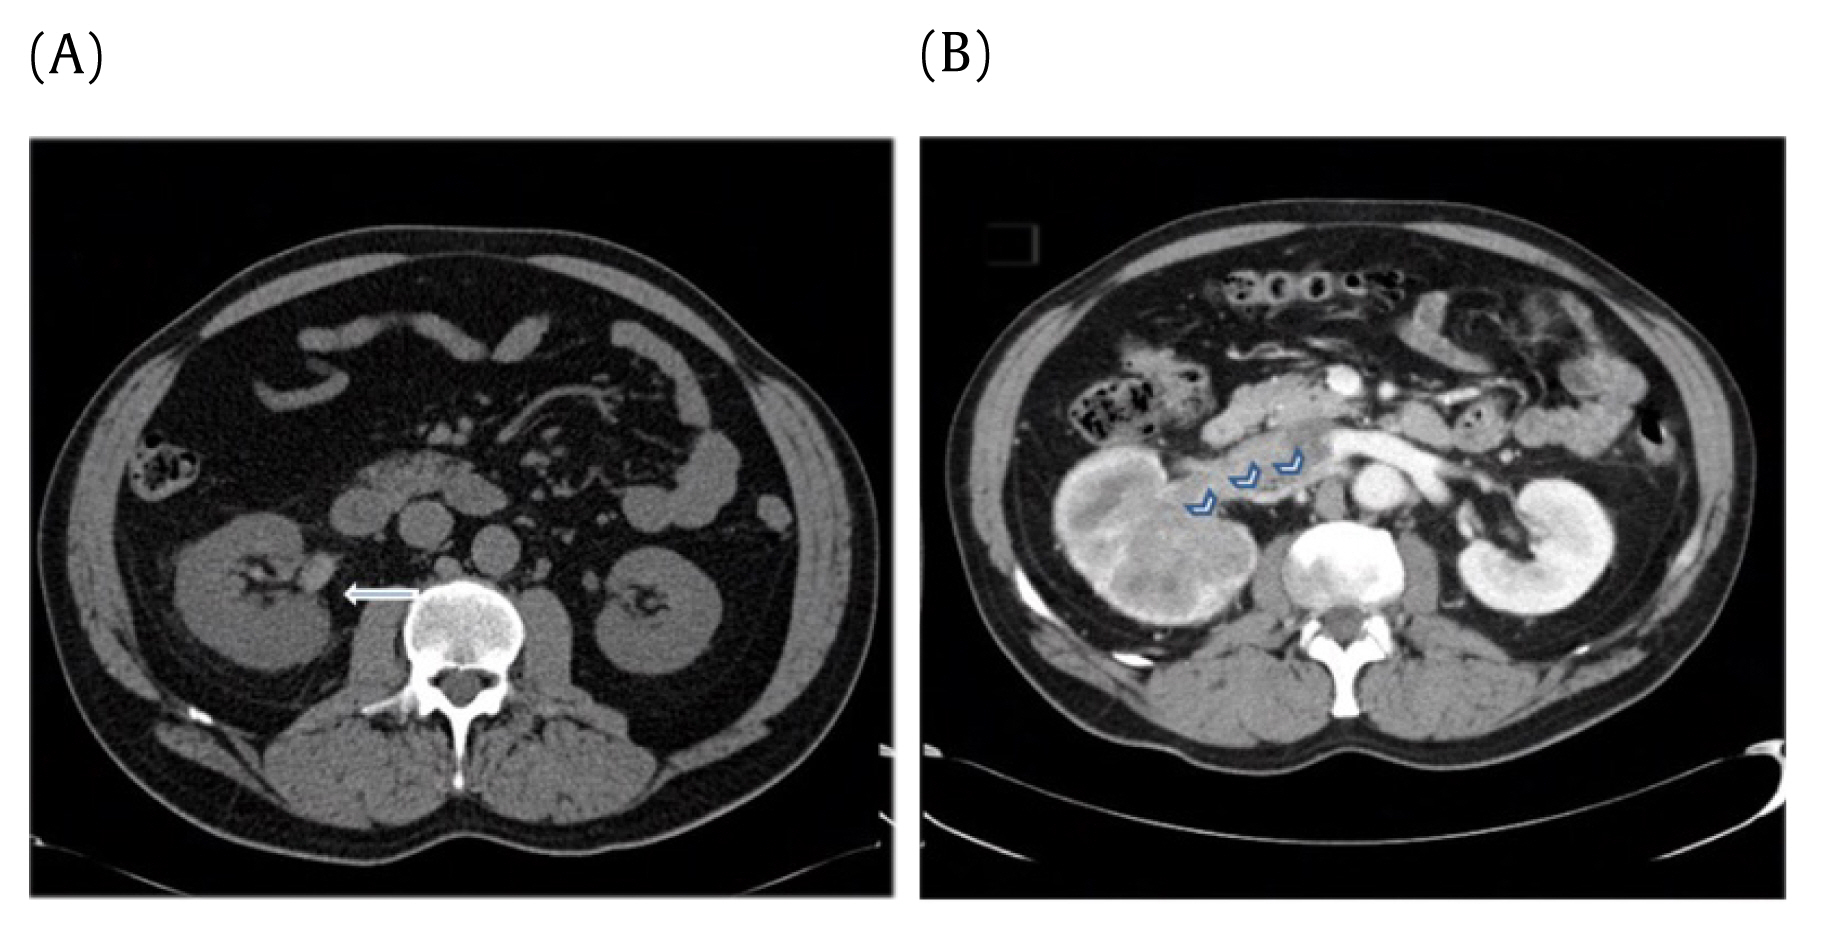
Importance of contrast. Radiodensity differences between CT without contrast (A and with contrast B).
The picture archiving and communication system software was the measurement program used to obtain all sarcopenia, myosteatosis, and L1 attenuation measurements.
4. Disposition and complications
Discharge data was collected (home verses care) from the institutional trauma registry (Tables 1 and 2). In-hospital complications were also taken from registry data, and included: acute kidney injury, acute lung injury, cardiac arrest, catheter-related blood stream infection, decubitus ulcer, surgical site infection (deep, superficial, organ space), deep venous thrombosis, compartment syndrome, myocardial infarction, osteomyelitis, pneumonia, pulmonary embolism, sepsis, stroke, unplanned intubation, unplanned admission to the intensive care unit, unplanned return to the operating room, and urinary tract infection (Table 3).
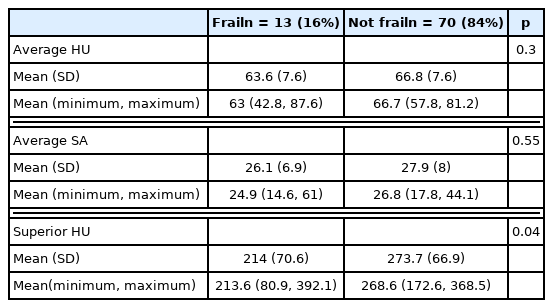
Relationship between radiographic and discharge disposition.

Contrast CT-only analysis: relationship between radiographic and discharge disposition.

Post-Admission complications.
5. Statistical analysis
Data was analyzed using R Version 3.6.1. The Student t test was used to assess frailty (mFI score ≥ 0.3), discharge disposition (home or care; Tables 1 and 2), and post-admission complications in relation to the 3 radiographical markers (Tables 4 and 5). Using multivariate analysis, whilst adjusting for age, each frailty index was represented as a binary “frail” (mFI score ≥ 0.3) vs “not frail” outcome, and correlated with respective measurements of sarcopenia, myosteatosis, and L1 attenuation. Spearman’s rho coefficients were generated for multivariate analysis and were described as odds ratios. Receiver operator characteristics curves were used to determine the accuracy of the regression modeling. Significance was set as p < 0.05.

Relationship between radiographic markers and postadmission complications
Contrast CT-only analysis: relationship between radiographic markers and post-admission complications.
Results
The patients studied had an average age of 43.19 (± 17.36) years, and there were 65% of patients who were male (n = 54), and 35% female (n = 29; Table 6). Of the 83 patients included, 13 were identified as frail using the mFI-5 (mFI score ≥ 3.0). Patients in the frailty group were significantly older (p < 0.001; Table 7).

Patient demographics.
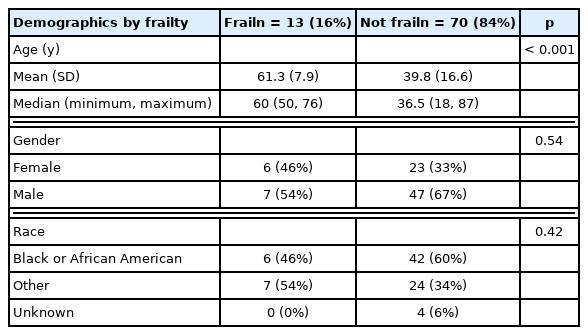
Patient demographics by frailty.
1. Radiographical markers of frailty
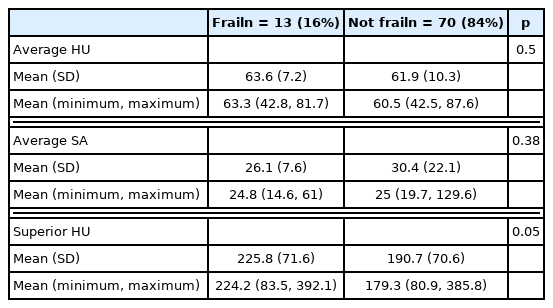
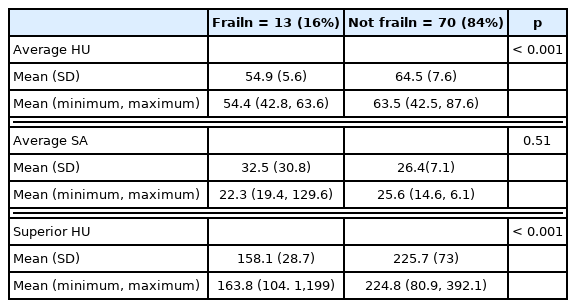
Frail patients had radiographical evidence of myosteatosis, and a lower average psoas HU (54.9 ± 5.6) when compared with non-frail patients (64.5 ± 7.6, p < 0.001; Table 8). Furthermore, frail patients had radiographical evidence of L1 attenuation, and a lower average superior HU (158.1 ± 28.7) when compared with non-frail (225.7 ± 73 HU) patients (p < 0.001; Table 8). In the contrast CT only subgroup analysis (Table 9), the average HU of the psoas muscle and superior HU of the L1 vertebra were significantly different between frail and non-frail patients (p < 0.0001). Multivariate regression (Table 10) analysis showed myosteatosis (average HU) was predictive of an mFI-5 score greater than or equal to 0.3 (p < 0.05).
Relationship between radiographic markers and frailty status (mFI Index ≥ 0.3).

Contrast CT analysis relationship between radiographic markers and frailty status (mFI Index ≥ 0.3).
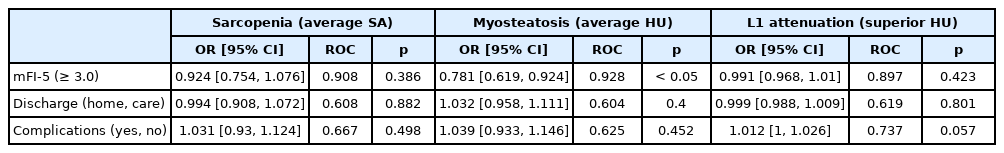
Multivariate logistic regression predicting the impact of radiographic markers on frailty, disposition, and complications.
Comparing patients who did or did not have an in-hospital complication, there was no difference observed for myosteatosis, sarcopenia, or L1 attenuation. Similarly, radiographical markers of frailty were not associated with discharge disposition (home or care).
Discussion
Morbidity and mortality in the United States due to trauma-related injuries accounts for nearly 150,000 deaths per year, coupled with over 100 billion dollars of healthcare expenditure [4]. Medical frailty is a well-known contributor to poor outcome following trauma [4]. Currently, several mFIs have been used for trauma and non-trauma patients to predict frailty, including the mFI-5, mFI-11, and mFI-15 [6–8, 10, 11]. While these have been shown to predict mortality and complications, they are often unable to be administered in an obtunded trauma patient. Radiographical markers, including psoas fatty atrophy, sarcopenia, and L1 attenuation have been proposed as surrogate markers of frailty [16,20–22]. These markers show potential for widespread use in trauma patients, where the CT CAP scan is often obtained at admission to hospitalization and triage. Prior to this study, there has been limited available evidence describing the relationship between radiographical markers of frailty, widely utilized trauma indices, and complications in trauma patients. The results of this study show that frailty, as measured by the mFI, was associated with radiographical markers on the CT CAP, including psoas myosteatosis and L1 attenuation.
The role of assessing frailty in the trauma setting is pressing, as it necessitates speed, simplicity, and ease of implementation in obtunded patients. In the geriatric population, the use of frailty markers in the course of treatment in trauma patients is well recognized [36]. However, the incorporation of validated frailty indices is limited by lack of training, insufficient time, and the perceived burden of using assessment tools [36]. In the last few years, several studies have demonstrated the capacity of frailty scores and markers to predict post-operative outcomes [37,38]. Frailty and malnourishment have demonstrated a synergistic effect when compared with malnourishment alone in predicting the potential for post-operative complications [38]. Frailty has also been shown to increase the risk of postoperative morbidity, even when controlling for other comorbidities, and demographic factors [37]. Additionally, the mFI has shown capacity to significantly predict morbidity and mortality in young orthopedic trauma patients [4]. Hypoalbuminemia, a marker of frailty, has also been demonstrated to have a powerful capacity to predict mortality and the postoperative course, following surgical fixation in nongeriatric lower extremity orthopedic trauma patients.
The relationship between radiographical markers and frailty is a recent focus of study in the trauma setting. Research on sarcopenia and myosteatosis has demonstrated an association with complications in surgical and cancer patient populations [27–32,39]. The presence of frailty is shown to be associated with mortality, adverse outcomes from discharge, and multisystem trauma complications [40]. Composite scores for radiographical markers for frailty including sarcopenia, and sarcopenic obesity are reported to predict a poor outcome from discharge from hospital [41]. Sarcopenia, along with other radiographical markers, have significantly demonstrated severe thoracic injury in the trauma setting [42]. With specific regards to orthopedic trauma, the simple radiographical marker Chin-on-Chest in Neck of Femur may be used to identify patients with increased frailty and risk of mortality following traumatic hip fractures [43]. This current study expands on prior findings and introduces a novel radiographical maker to the dialogue of identification of frailty by expanding the current understanding of how the radiographical marker L1 vertebra attenuation is related to frailty. Current literature highlights its relationship with aging and osteoporosis [22], but the relationship with frailty indices has not been well-defined [33–35].
This study is a prospective cohort of orthopedic, and general trauma patients and includes an assessment of the mFI-5 and multiple radiographical markers (including sarcopenia, myosteatosis, and L1 attenuation) in the same patient. Previous studies have been limited because they have often studied separate populations [30,31,44–46]. Furthermore, the addition of the L1 attenuation is novel to the diagnostic algorithm in trauma patients. Moreover, the role of contrast in the CAP CT scans was incorporated because this is a key component to density measurements [47]. The primary weakness of the study was that the study was not powered to assess the associations with complications, mortality, and hospital utilization. Future, large, prospective series will need to incorporate the frailty indices, and radiographical measurements to assess the predictive validity of these outcomes.
In conclusion, radiographical markers of frailty (myosteatosis and L1 attenuation) in this study were associated with frailty as measured by the mFI-5 in trauma patients. This allows a quick, comprehensive assessment using data already obtained during the trauma work-up, and facilitates early interdisciplinary coordination of care for trauma patients.
Notes
Conflicts of Interest
The authors have no conflicts of interest to declare.
Ethical Statement
The study was a prospective cohort with informed consent and the IRB number is IRB00086957.