The Status of Protein Supply to Patients in the Trauma and Surgical Intensive Care Units and the Effects of Feedback on Protein Supply: A Multicenter Study
Article information

Abstract
Purpose
To investigate the status of protein supply by comparing the recommended amount with the delivered amount of protein in patients in the trauma and surgical intensive care units (ICU). Feedback on the protein supply status was presented to each hospital, and we evaluated whether the protein supply had increased to an appropriate level.
Methods
In this retrospective observational multicenter study, nutritional information on patients in the trauma and surgical ICUs who had received nutritional support intervention was collected on the 1st Wednesday of each month at two-month intervals from August 2020 to June 2021, from nine domestic hospitals in Korea. Every two months, the nutritional status of each hospital was shared with all hospitals, and each nutritional support team received feedback on protein supply status.
Results
There were 246 patients from nine hospitals included in this study, and data over the study period from six protein days, were analyzed. The mean ratios of delivered calories to calculated required calories were 74.0%, 80.8%, 85.4%, 77.9%, 71.3%, and 82.1% on Protein Days 1, 2, 3, 4, 5, and 6, respectively. The mean ratios of delivered protein to calculated required protein were 73.0%, 77.2%, 78.9%, 79.3%, 69.4%, and 89.6% on Protein Days 1, 2, 3, 4, 5, and 6, respectively.
Conclusion
Protein supply increased to an appropriate level, feedback on protein supply status may have increased the protein supply ratio and promoted appropriate protein supply and nutritional support for patients in the trauma and surgical ICUs.
Introduction
Insufficient nutritional support of critically ill patients is closely associated with poor outcomes such as increased complications and mortality [1,2]. Patients admitted to the intensive care unit (ICU) often have medical problems such as cardiovascular comorbidities, hepatic dysfunction, sepsis, and general weakness, and the accompanying risk of malnutrition is high. In addition, the treatment of trauma and burns, and surgeries, commonly performed for patients in surgical ICUs, increase the metabolic requirements of patients [3]. Therefore, proper nutritional support in compliance with proper guidelines is essential for these patients.
Among the various nutrients available for nutritional support in critically ill patients and patients with trauma, the most important is protein. Considering that an insufficient protein supply negatively impacts the short-term clinical course [4–6], guidelines emphasize sufficient protein supply, and depending on the patient’s condition, additional protein supply is sometimes required. The recommended protein amount for critically ill patients is 1.3 g/kg/day as per the European Society for Clinical Nutrition and Metabolism guidelines [7] and 1.5 g/kg/day as per the American Society for Parenteral and Enteral Nutrition guidelines [8].
Audits and feedback are representative methods for improving adherence to guidelines [9]. Audits and feedback methods decrease the gap between current practice and recommendations, and the feedback methods become more influential. For example, Merlani et al [10] reported that the number of requests for blood gas analysis in the ICU could be reduced through interactive training and repetitive feedback, thereby reducing the amount of blood drawn for testing, time wasted, and cost. Elliott et al [11] reported that sedation scoring systems and sedation guidelines could be successfully adopted through repeated trials and feedback.
This study aimed to evaluate the current status of protein supply in patients in the trauma and surgical ICUs by examining the amount of protein consumed compared with the recommended amount of protein supplied. Additionally, we investigated whether protein supply increased to an appropriate level over time.
Materials and Methods
This multicenter, retrospective, observational study protocol was approved by the Institutional Review Board of each institution (n = 9). Consent from the patients or their legal guardians were obtained according to the guidelines. All procedures were conducted in accordance with the tenets of the Helsinki Declaration of 1964 and later versions, and they were performed according to the relevant guidelines.
Adult patients aged ≥19 years treated for more than 72 hours in the trauma and surgical ICUs were included in the study. Patients who were hemodynamically severely unstable to the extent that nutritional support could not be considered and patients who were brain-dead were excluded from the study.
Data were collected six times at 2-month intervals as follows: Protein Day 1 (August 5, 2020), Protein Day 2 (October 7, 2020), Protein Day 3 (December 2, 2020), Protein Day 4 (February 3, 2021), Protein Day 5 (April 7, 2021), and Protein Day 6 (June 2, 2021). Data collected included: (1) patient characteristics (age, sex, comorbidities, height, and body weight); (2) disease severity [acute physiology and chronic health evaluation 2 (APACHE 2) score and sequential organ failure assessment (SOFA) score]; (3) nutritional status [modified nutrition risk in the critically ill (NUTRIC) score, route of nutritional support, estimated calorie and protein requirements, prescribed amounts of calories and protein, and delivered amounts of calories and protein]; and, (4) support for organ failure (mechanical ventilation, continuous renal replacement therapy, and extracorporeal membranous oxygenation). Every 2 months, all institutions shared the data collected from each institution and received feedback on their protein supply status.
After the data from each institution was collected, the data about how many people were registered at the institution, and the amount of calories and protein prescribed and supplied to each patient were compiled into a single file. This file was sent to all researchers by e-mail and the mean value of each protein day was announced through a messenger discussing the progress of the study. The feedback was conducted by the researchers who prescribed nutritional support directly to the registered patients, and it was sent a few days earlier as a reminder before the next protein day so as not to miss patient registration.
The primary outcomes were the proportion of patients who were supplied sufficient protein and the changes in protein supply. The secondary outcome was the gap between the estimated protein requirement and delivered protein amount, and the reason for insufficient protein supply.
Statistical analysis was performed using SPSS Version 23.0 (SPSS, Inc., Chicago, IL, USA). Continuous variables are described as mean ± SD. Categorical variables are reported as numbers (%).
Results
Data from nine institutions was included in this study and 246 patients were assessed over the six protein days. The mean age of the patients was 64.9 ± 16.1 years, and 68.3% (168/246) of the patients were men. The mean APACHE 2 score was 23.3 ± 10.2, and the mean SOFA score was 6.9 ± 4.1. The mean modified NUTRIC score calculated for malnutrition risk assessment was 4.8 ± 2.1 (Table 1).
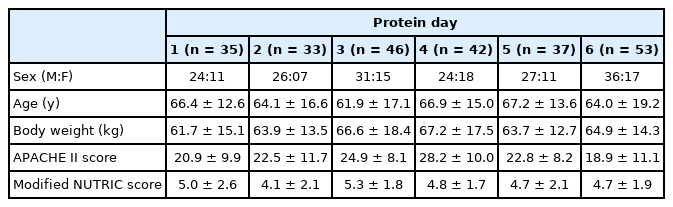
Patient Characteristics.
The mean prescribed and delivered amounts of calories were 1,295.0 kcal and 1,103.7 kcal, respectively, on Protein Day 1; 1,315.1 kcal and 1,252.0 kcal, on Protein Day 2; 1,364.4 kcal and 1,334.8 kcal, on Protein Day 3; 1,343.9 kcal and 1,168.1 kcal, on Protein Day 4; 1,241.2 kcal and 1,098.3 kcal, on Protein Day 5; and, 1,431.6 kcal and 1,314.6 kcal, on Protein Day 6, respectively. The mean ratio of delivered to prescribed calories was the lowest on Protein Day 1 (85%) and highest at on Protein Day 3 (97%), without any trend over the study period (Supplemental Tables 1–6). The mean ratio of calories delivered to the estimated required calories was 74.0% on Protein Day 1 and 89.6% on Protein Day 6, and there was no trend (Table 2 and Figure 1).
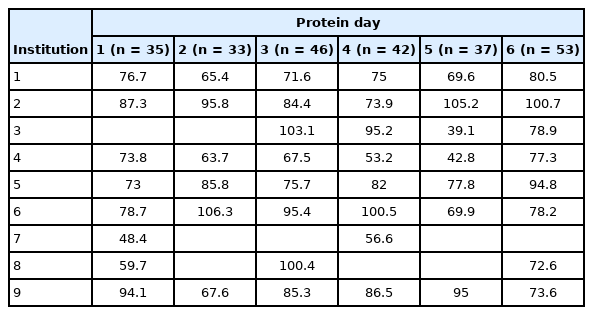
Mean ratio (%) of the delivered calories to the calculated required calories.
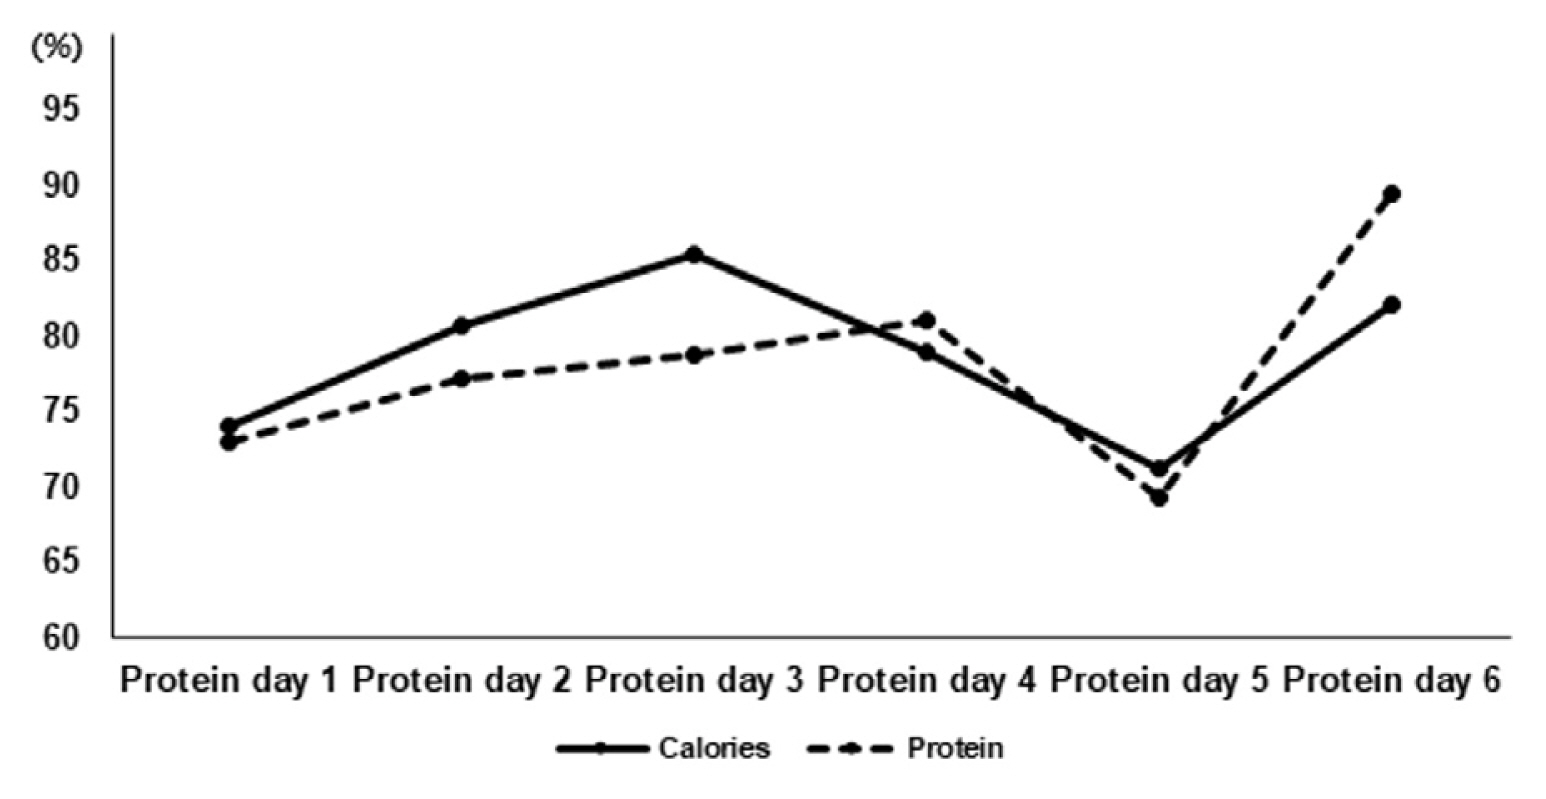
Change in the ratio of the delivered calories and protein to the estimated required amounts.
The mean prescribed and delivered amounts of protein were 63.0 g and 52.8 g, respectively, on Protein Day 1; 63.6 g and 60.1 g, on Protein Day 2; 60.8 g and 57.4 g, on Protein Day 3; 72.7 g and 64.0 g, on Protein Day 4; 58.3 g and 49.5 g kcal, on Protein Day 5; and, 75.7 g and 60.4 g, on Protein Day 6, respectively. The mean ratio of delivered protein to prescribed protein was the lowest on Protein Day 6 (79.8%) and highest on Protein Day 2 (94.5%), showing a decreasing trend (Supplemental Tables 1 to 6). The mean ratio of the delivered protein amount to the estimated required protein amount showed an increasing trend from 73.0% on Protein Day 1 to 89.6% on Protein Day 6 (Table 3 and Figure 1).

Mean ratio (%) of proteins delivered to the calculated required protein.
The reasons for the mismatch between the amount of protein prescribed and the amount of protein delivered are presented in Table 4.
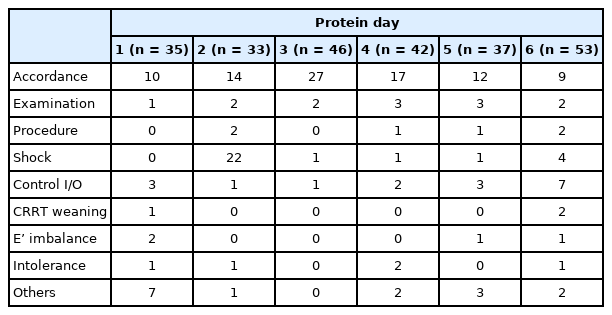
Cause of the mismatch between the prescribed amount and the delivered amount.
Discussion
Protein supply in critically ill patients is strongly associated with clinical outcomes. In the acute phase of critical illness, protein catabolism increases [3] and skeletal muscle mass decreases owing to increased proteolysis. Insufficient protein supply leads to prolonged mechanical ventilation, a longer hospital stay, a higher readmission rate, increased mortality, and worse long-term physical function and quality of life [4–6]. In addition, it can increase the burden on caregivers and patients [12]. However, critically ill patients may fail to receive adequate nutrition due to hemodynamic instability, mechanical gastrointestinal obstruction, fasting for evaluation or intervention, and fluid restriction.
When protein supply is optimal in the critically ill, clinical outcomes improve. A large-scale multicenter observational cohort study by Alverda et al [13] reported that increased protein supply in patients in the ICU significantly reduced infection-related complications. In addition, a study by Ferrie et al [14] reported that higher levels of delivered amino acids were associated with improved handgrip strength and muscle mass.
The optimal protein amount varies depending on different factors including the type of injury. In general, the recommended protein amount for critically ill patients is 1.3 g/kg/day [7,8]. Some studies have reported that the amount of protein recommended in the guidelines may not be sufficient and should be as per the patient’s condition, such as in the case where extracorporeal membranous oxygenation is used or if the patient is obese [13,15]. Clinicians try to adhere to the recommended guidelines, but there are considerable differences between the doses prescribed and those delivered to the patients. An International Nutritional Survey performed on more than 4,000 patients in 187 ICUs worldwide in 2014 showed that the amount of protein prescribed by medical staff to the patient was 1.3 g/kg/day, which was consistent with the guideline [16]. However, the actual amount of protein delivered to patients was only 55% of the prescribed amount. Moreover, only 11 ICUs delivered more than 80% of the prescribed amount of protein, and this accounted for 5.9% of the total number of ICUs included in the survey [16].
The reason for this gap between the prescribed and delivered amounts of protein is the discontinuation of nutritional support due to diagnostic evaluations or invasive procedures requiring fasting, hemodynamic instability, volume restriction, and malfunction of the nutritional support route [17]. Therefore, for the total amount of prescribed protein to be completely delivered to the patient, the relevant medical staff must endeavor to reduce the frequency of evaluations and procedures. This would, include avoiding unnecessary fasting for evaluation or procedures in patients whose airway is protected with an endotracheal tube, reducing the infused volume by prescribing a concentrated formula, and checking the route for nutritional support to ensure patency is achieved.
In this current study it was hypothesized that audits and feedback methods could help clinicians determine whether the prescribed amount of protein was being delivered in full. The strength of this study was that feedback was performed multiple times over a short period and the amount of protein delivered increased steadily (with the exception of Protein Day 5) through the period of audits and feedback. This was consistent with the findings reported by Sinuff et al [18], who observed that audits and feedback could improve nutritional support in ICUs. The reason the clinician’s practice improved nutritional support between audits and feedbacks was explained as perceived peer pressure [18,19].
There were nutritional support teams from 9 ICUs who participated in the current study, and the fact that the results from our ICU would be disclosed to everyone may have provided motivation and increased concern about protein delivery. Another reason which may have increased concern may have come from the gap between the prescribed amount and the delivered amount on Protein Day 1 which was approximately 70% of the prescribed amount. This amount was probably much lower than anticipated and would have indicated that more attention should be paid to the actual delivery of protein.
Although this study produced meaningful results, it had several limitations. Firstly, considering that this was a multicenter prospective observational study, the number of patients per protein day was relatively small (30–40). Owing to the COVID-19 pandemic, the number of patients in the surgical ICU decreased significantly during the study period. In addition, because the reason for intensive care of the patients was not specified, the homogeneity in the patient group was relatively low. Secondly, an increase in protein supply was revealed through feedback; however, it could not be determined whether this result was associated with a significant clinical outcome, such as a decrease in in-hospital mortality or preservation of function upon discharge, owing to the study design, in which there was no control group in which feedback was not applied. Thirdly, since this study was conducted by collecting data from different patients on each protein day, it was not possible to know how the patient’s nutritional supply changed before and after feedback, nor could it be analyzed using the statistical methods used for continuous measurement variables. In addition, as mentioned previously, there were many hospitals where the trauma and surgical ICU was not functioning normally due to the effects of COVID-19, and the amount of data in some hospitals was too small. Therefore, this may have skewed the results of this study. Nevertheless, the mean value of all patients showed an increasing trend for the amount of protein delivered. Although a sudden decrease in the number of calories on Protein Days 4 and 5 and the amount of protein delivered on Protein Day 5 was observed, compared with the estimated required amounts, it can be interpreted as reflecting the unavoidable situations in the real world. Finally, it could not be ascertained whether improved clinical practice could be maintained without feedback. If it is practically difficult to expand the infrastructure for feedback alone, the automation of digital feedback through an electronic medical system may be considered as an alternative.
Conclusion
Feedback on the actual protein supplied to patients by the nutritional support team in the trauma and surgical ICUs for each hospital appeared to increase. Therefore, this feedback activity may improve the protein supply and nutritional support for patients in the trauma and surgical ICUs.
Supplementary Material
Notes
Author Contribution
Conceptualization: JML. Methodology: JML, HJL, JGL, MCK and HYK. Formal investigation: JML, HJL, JGL, MCK and HYK. Data collection: SYO, JML, JSK, HJL, NJC, IKK, MCK, HYK and SHY. Data analysis: HYL and JML. Writing original draft: SYO, JML and HYL. Writing - review and editing: SYO and JML.
Conflicts of Interest
The authors declare that they have conflicts of interest.
Ethical Statement
This research did not involve any human or animal experiment.
Data Availability
All relevant data are included in this manuscript.
Funding
This study was supported by a research grant from the Korean Society of Acute Care Surgery.