 |
 |
- Search
| J Acute Care Surg > Volume 14(1); 2024 > Article |
|
Abstract
Purpose
Methods
Results
Conclusion
Notes
Author Contribution
Conceived the idea, formatted the data, and supervised the writing process: DHK. Performed all the statistical calculations, wrote the original manuscript, and repeatedly edited it: YH. All listed authors contributed to the study design and data collection and approved the final version of the manuscript.
Funding
This study received research funding from the Korean Society of Acute Care Surgery. This research was also supported by the Bio&Medical Technology Development Program of the National Research Foundation (NRF) funded by the Korean government (MSIT; no.: RS-2023-00220408).
Ethical Statement
The study was approved by the institutional review board of each participating center (IRB no.: DKUH 2023-05-010; GCIRB 2023-324; AJOUIRB-DB-2023-327; CHH-2023-L12-01, CR323148). Given the study’s retrospective nature, the informed consent was waived. However, patient data were anonymized and handled following the ethical standards of the Declaration of Helsinki. The datasets analyzed during the current study are not publicly available due to ethical restrictions.
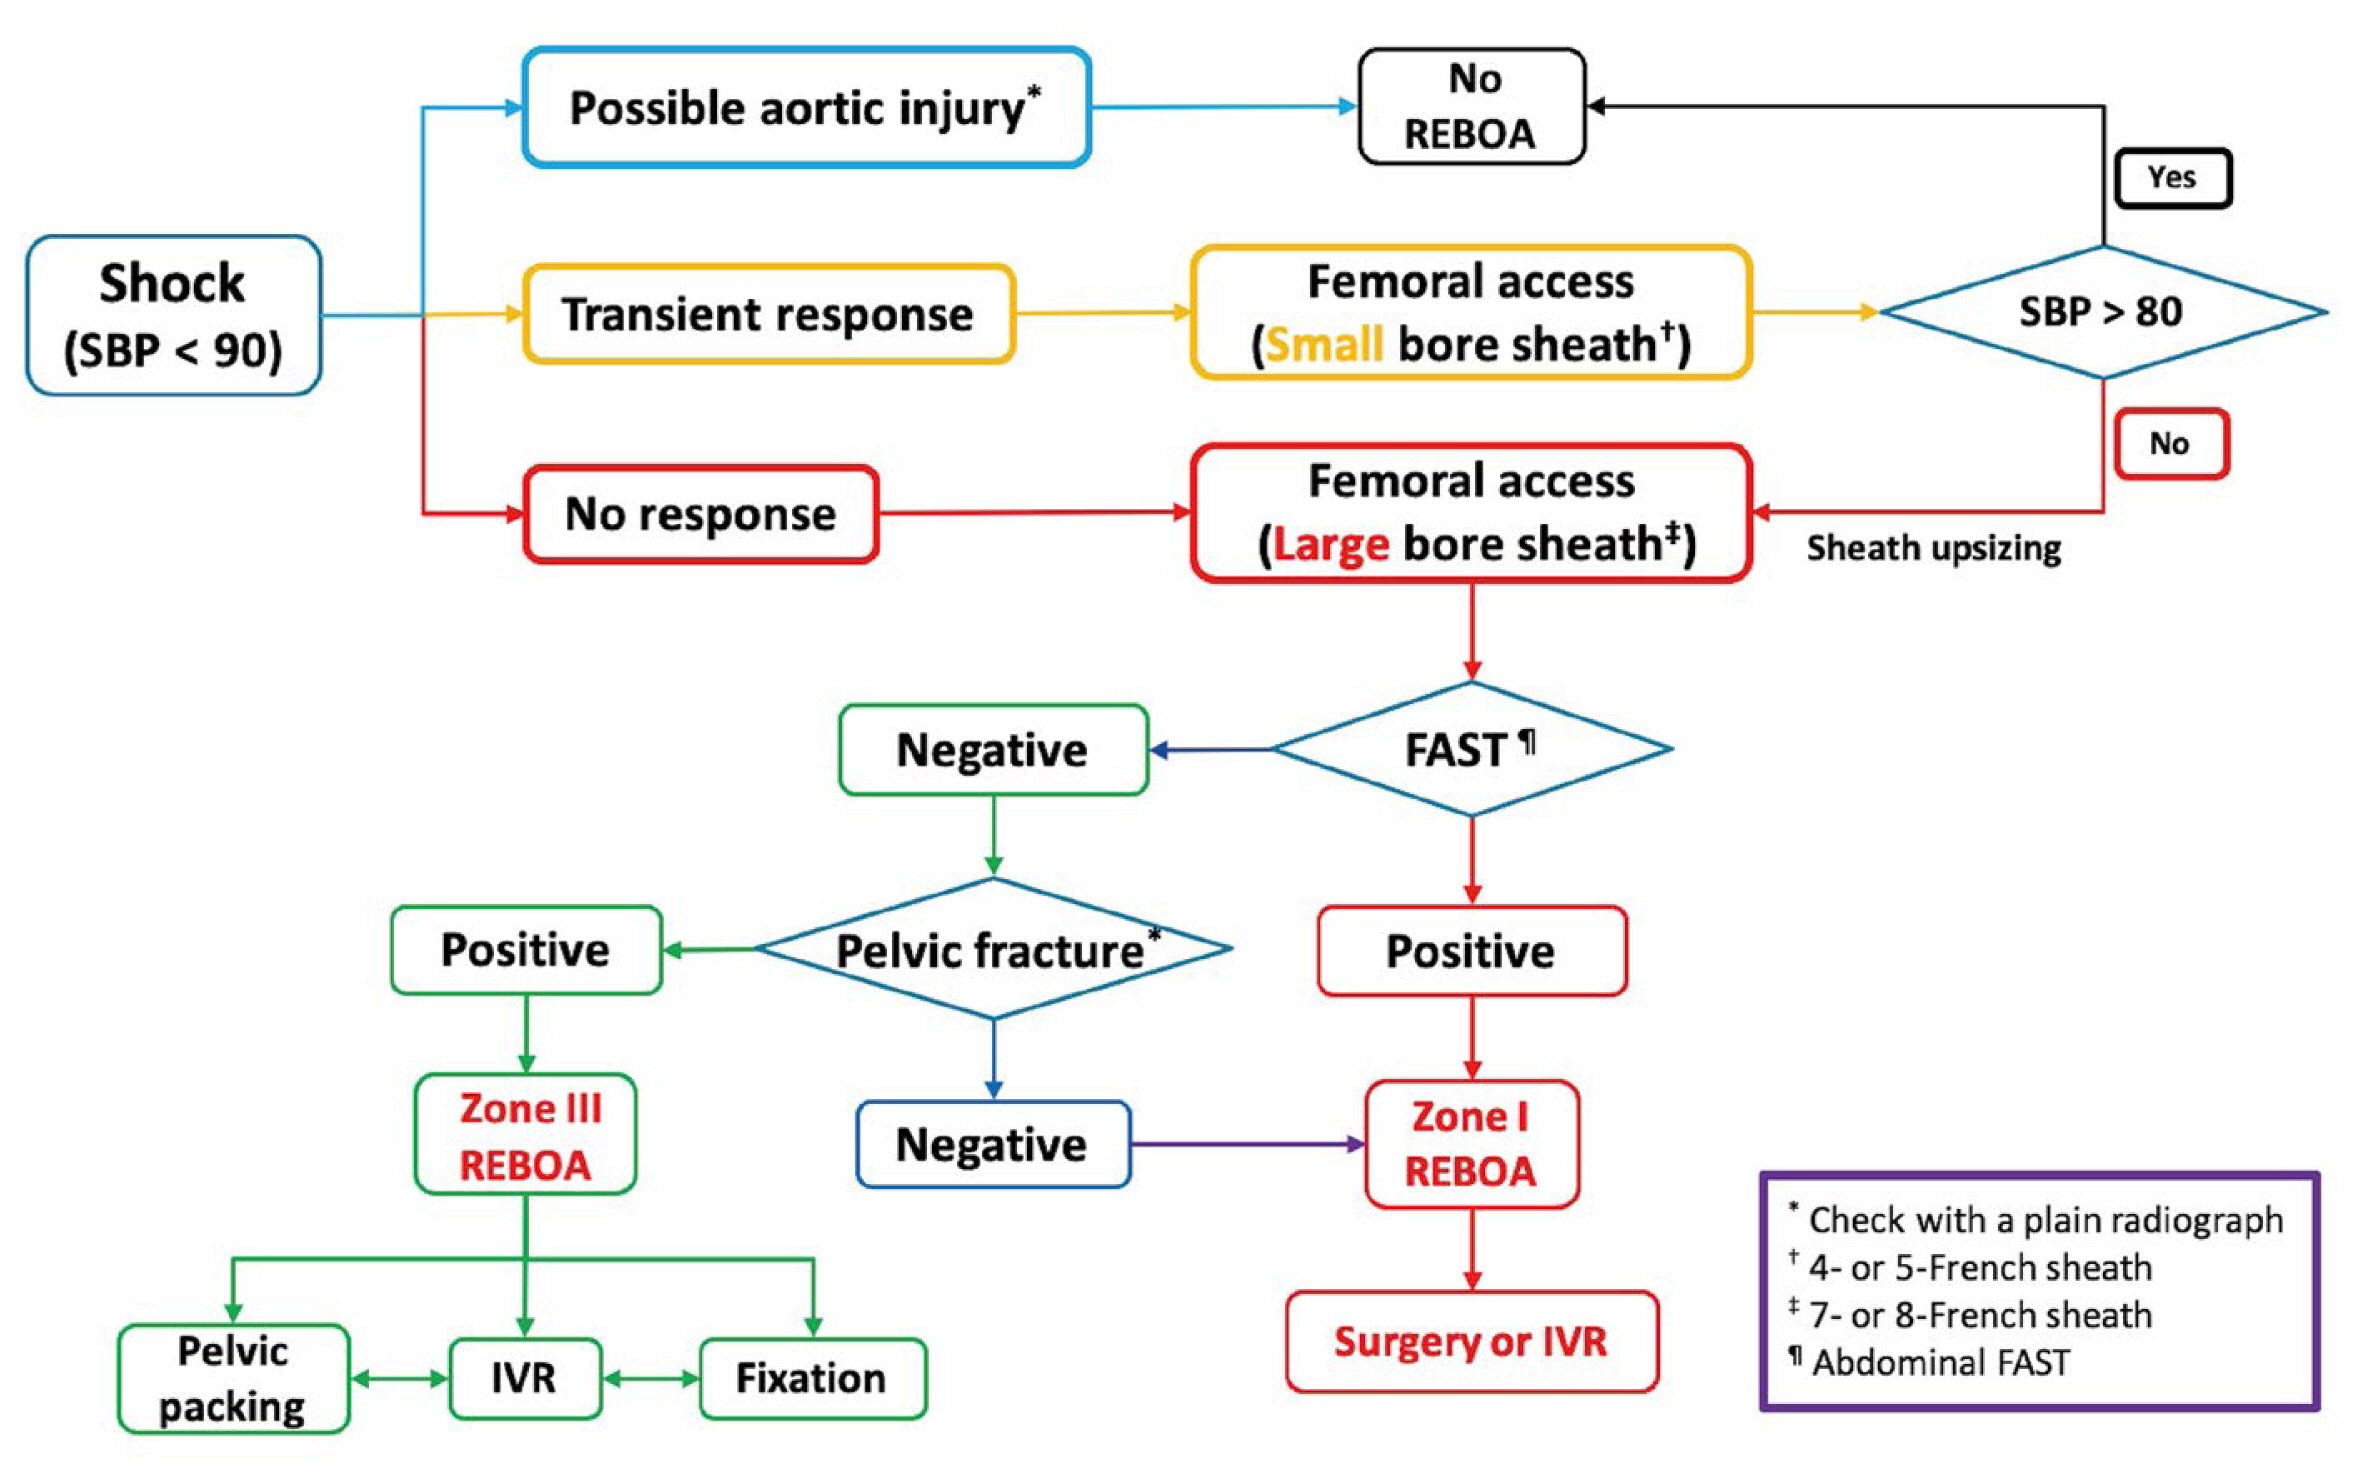
Figure 1

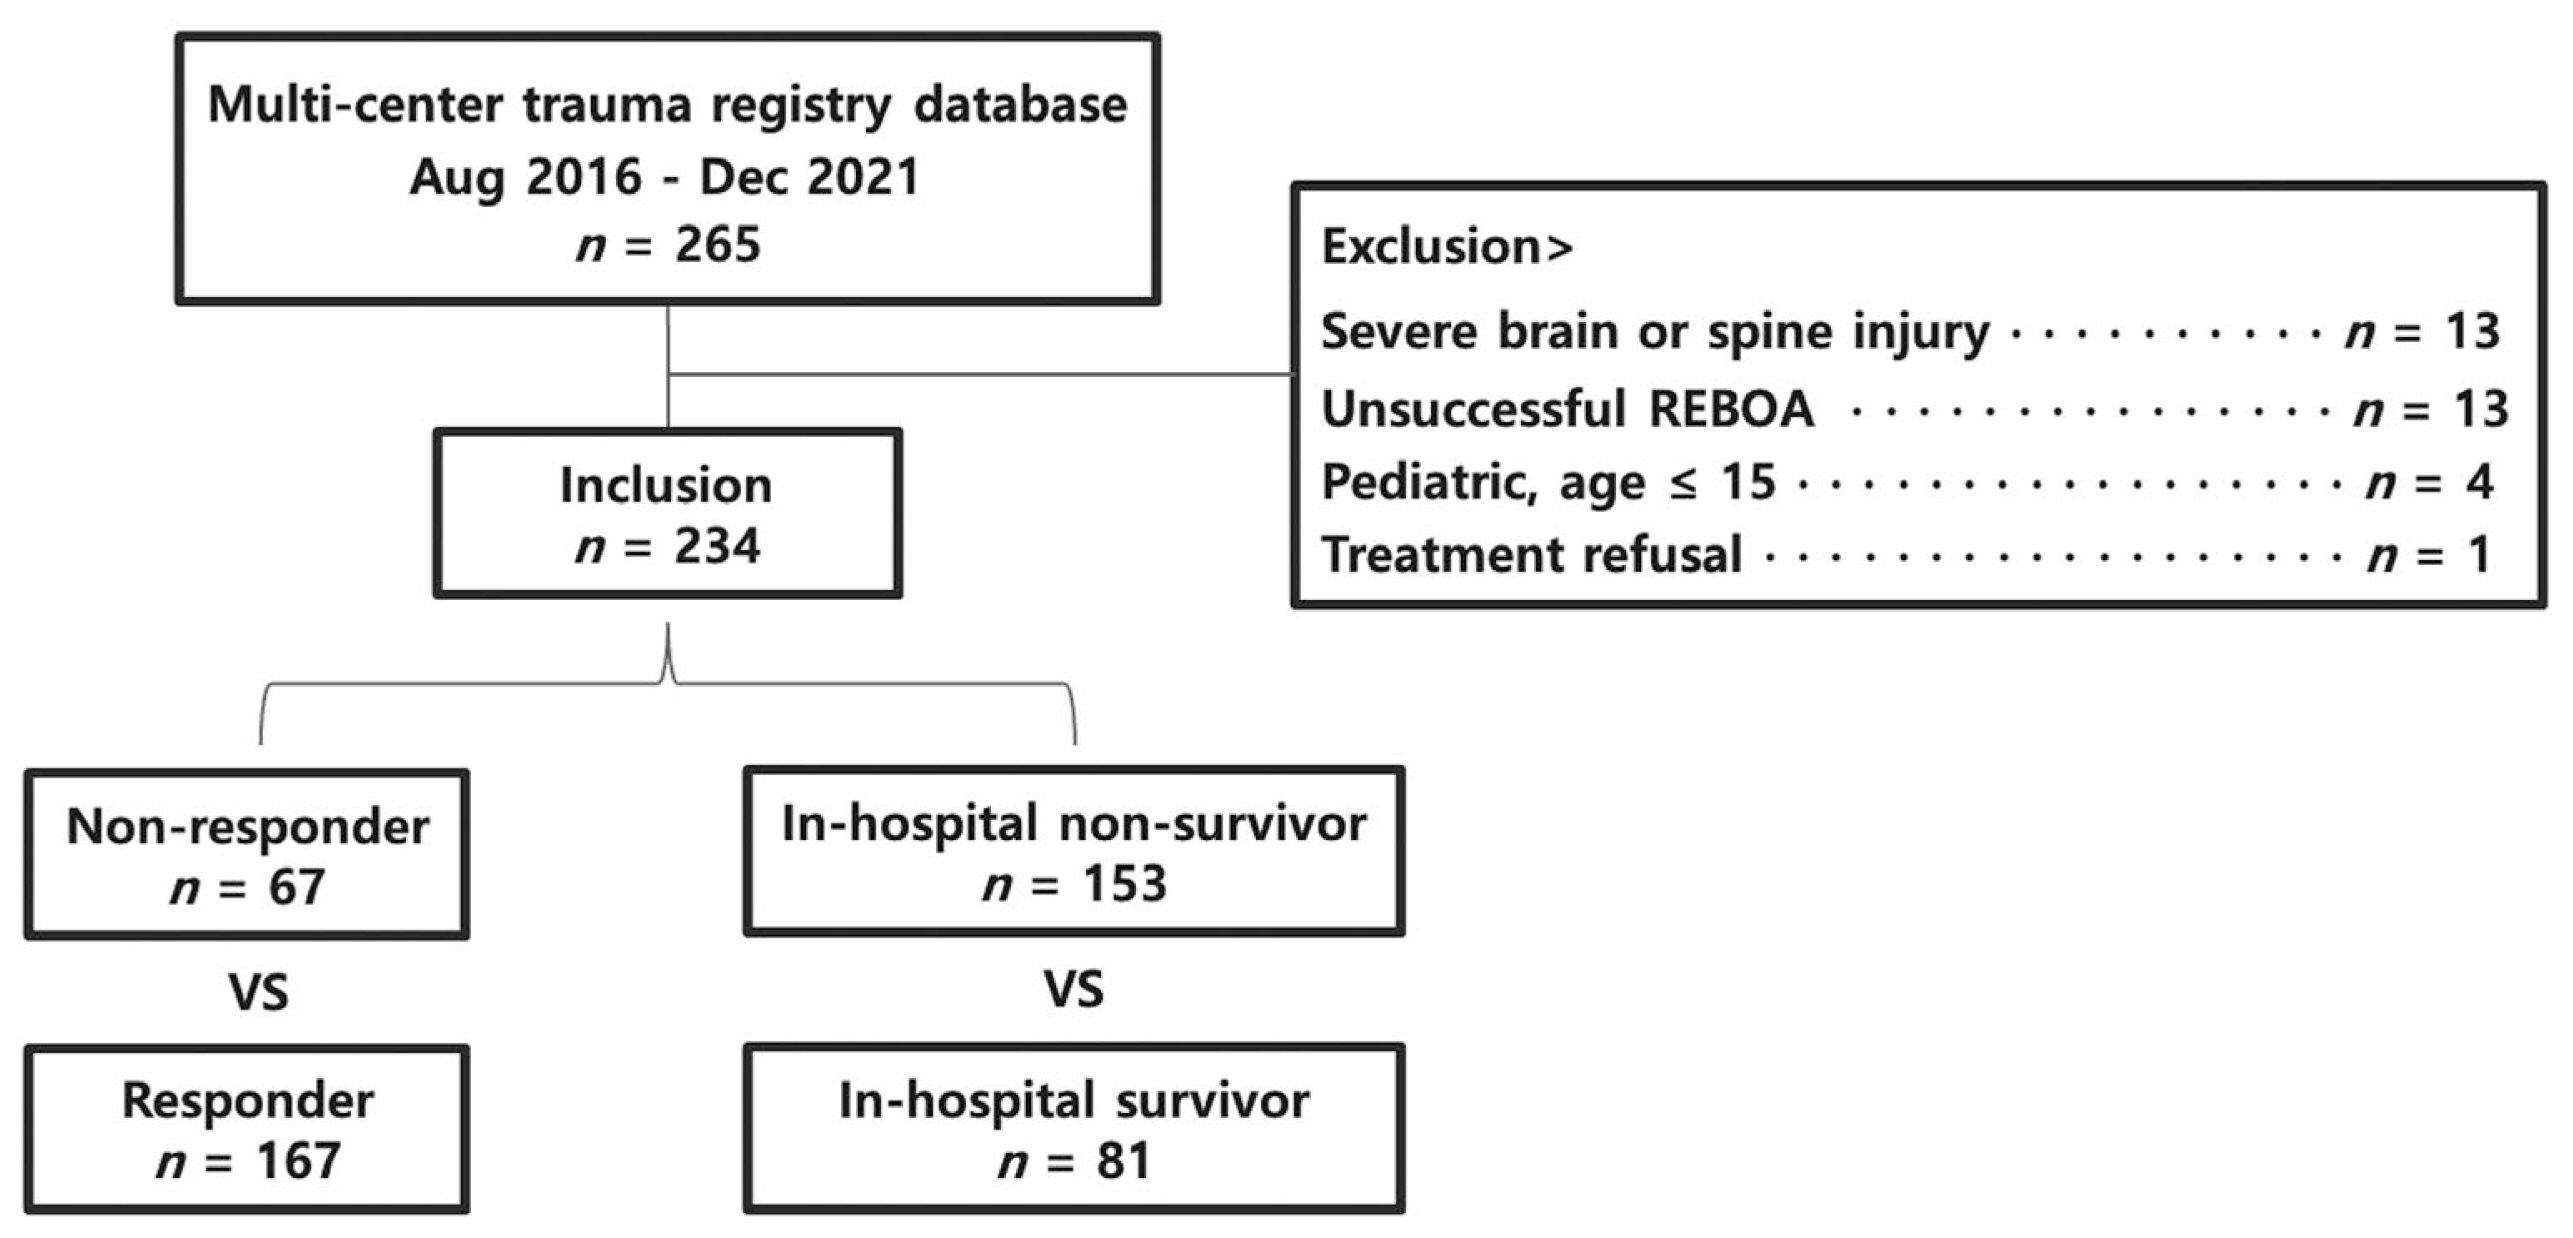
Figure 2

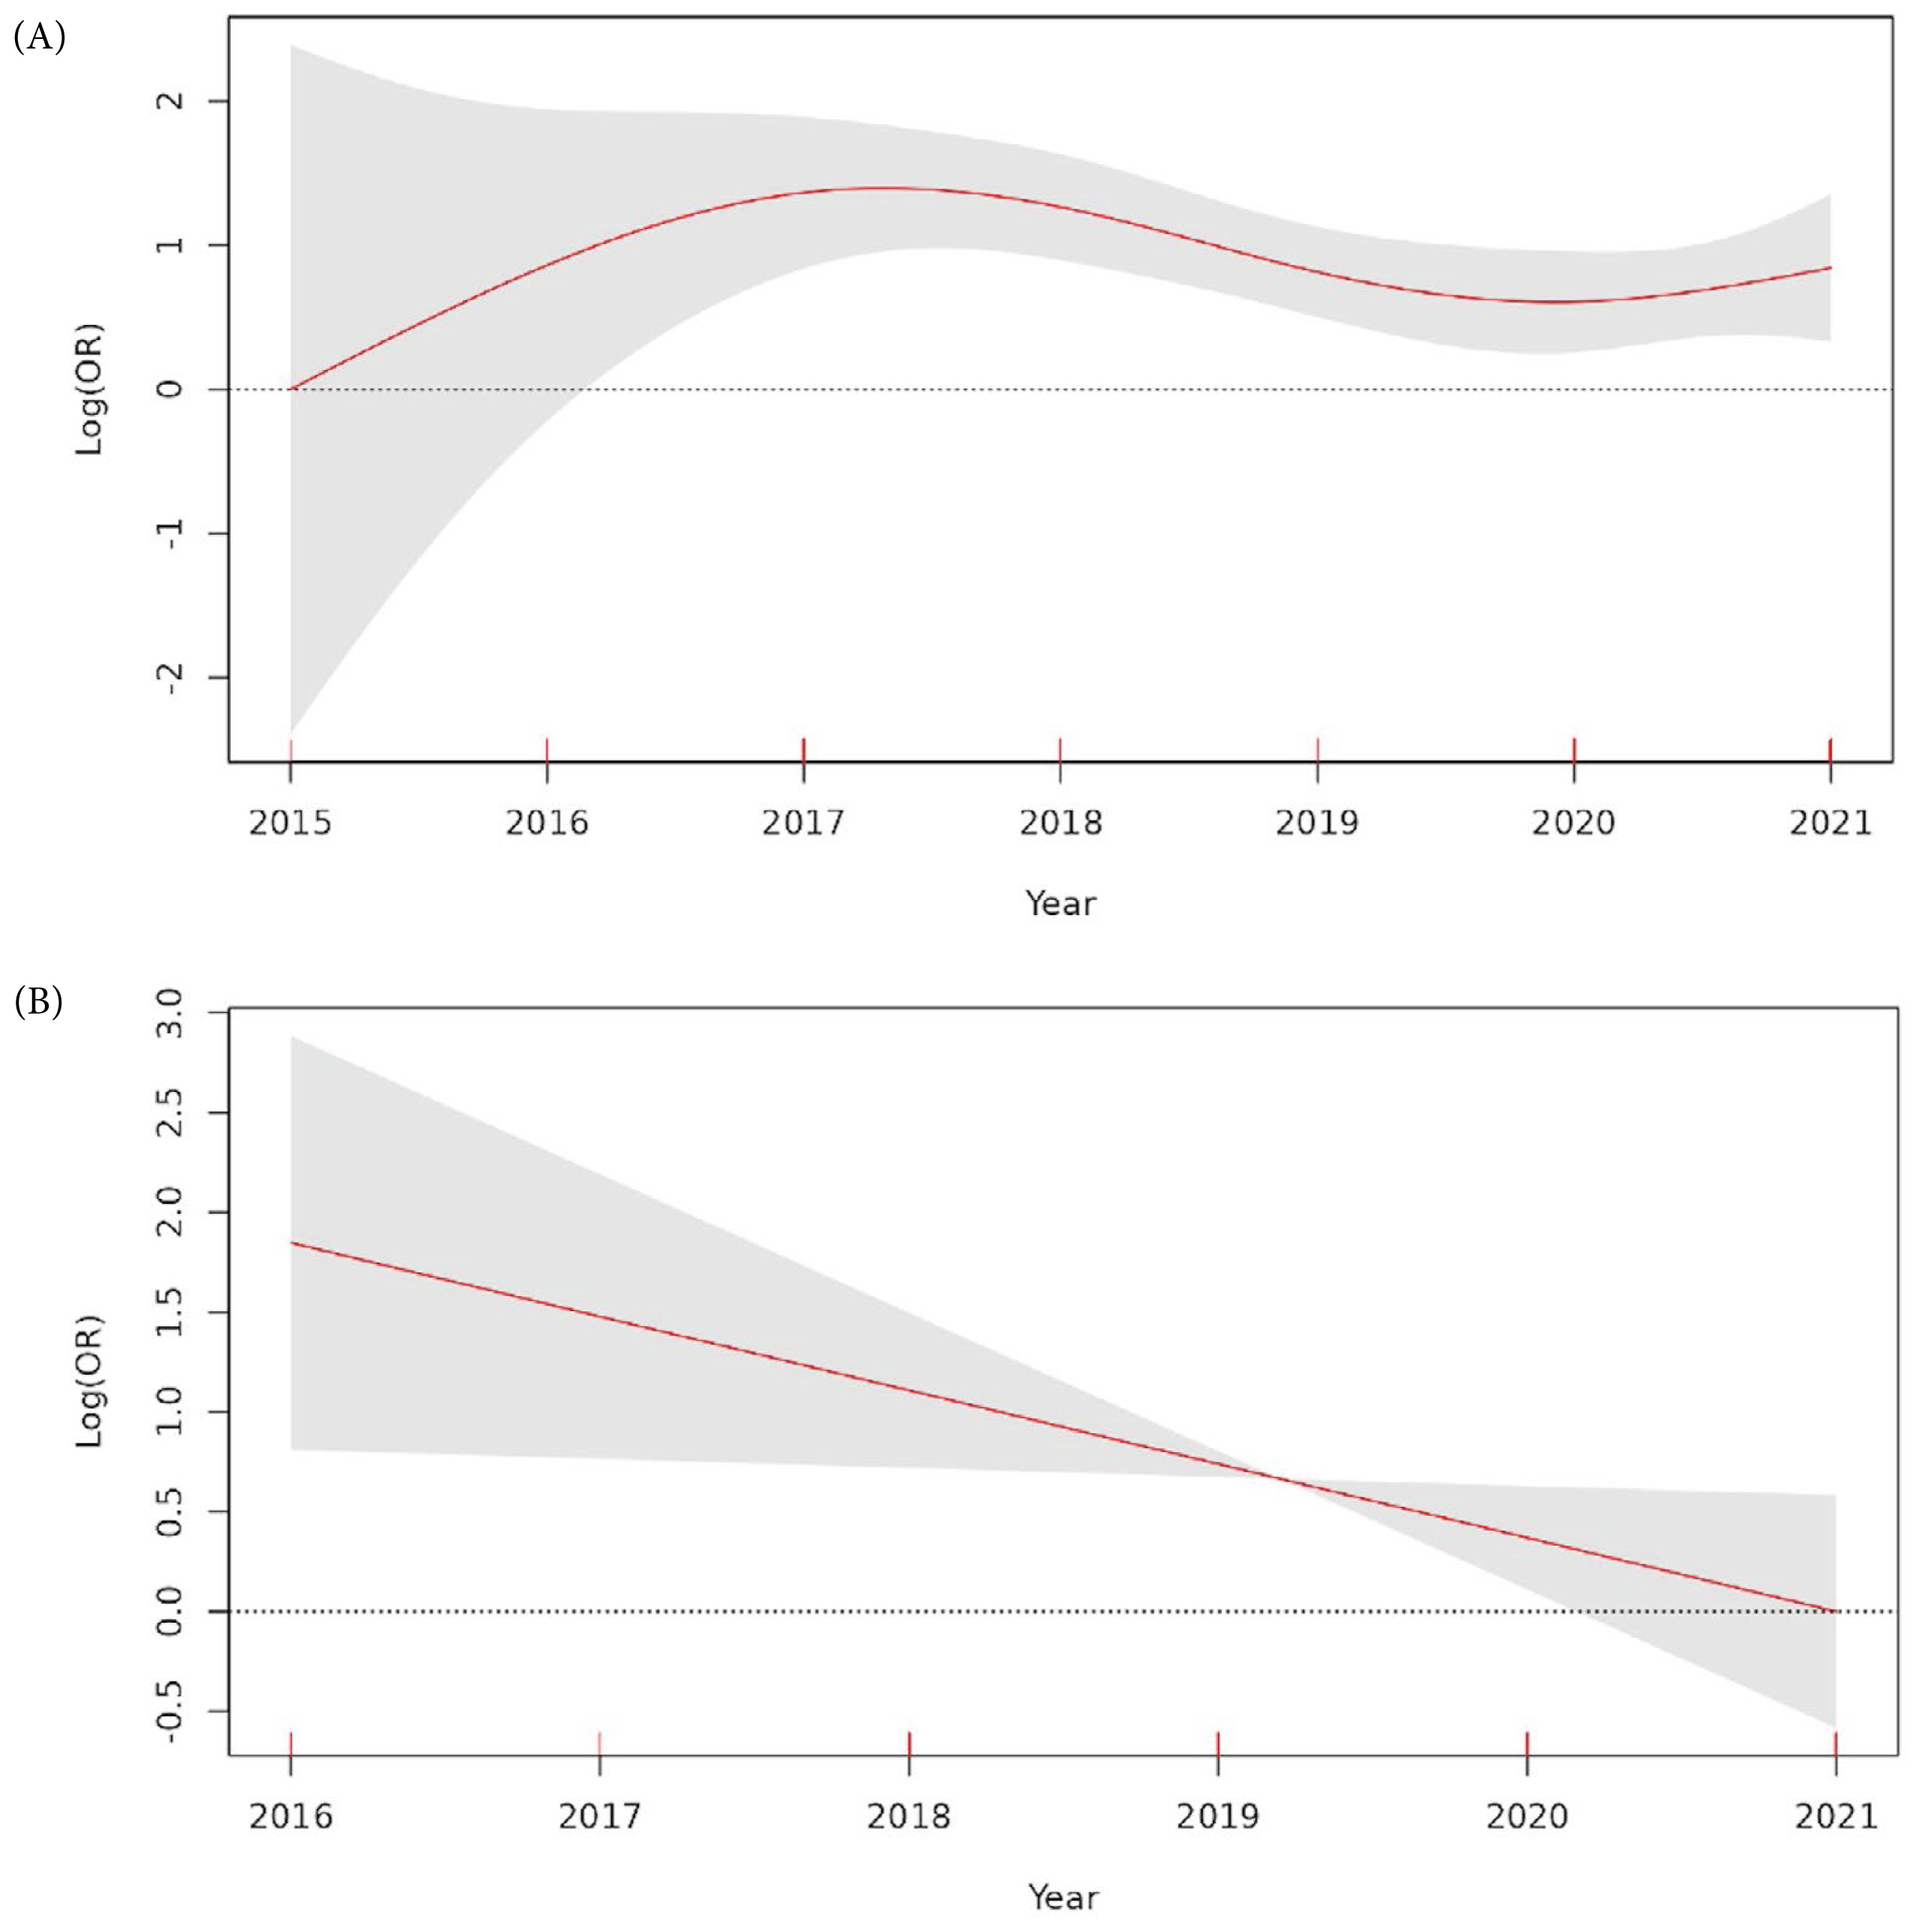
Figure 3

Table 1
| Variables | Overall (n = 234) | In-hospital non-survivor (n = 153) | In-hospital survivor (n = 81) | p |
|---|---|---|---|---|
| Age (y) | 51.2 ± 19.2 | 53.4 ± 19.4 | 48.9 ± 16.9 | 0.067 |
|
|
||||
| Sex, male (%) | 175 (73.5) | 111 (72.5) | 62 (76.5) | 0.613 |
|
|
||||
| Injury cause (%) | ||||
| 1. Traffic accident | 167 (70.2) | 110 (71.9) | 56 (69.1) | 0.771 |
| 2. Fall from heights | 46 (19.3) | 29 (19.0) | 14 (17.3) | 0.891 |
| 3. Other blunt | 18 (7.6) | 11 (7.2) | 7 (8.6) | 0.89 |
| 4. Stab wound | 7 (2.9) | 3 (2.0) | 4 (4.9) | 0.239 |
|
|
||||
| Injury mechanism (%) | ||||
| 1. Blunt | 230 (96.6) | 149 (97.4) | 77 (95.1) | 0.453 |
| 2. Penetrating | 7 (2.9) | 3 (2.0) | 4 (4.9) | 0.239 |
| 3. Both | 1 (0.4) | 1 (0.7) | 0 (0.0) | 1 |
|
|
||||
| Prehospital time (min) | 79.2 ± 75.0 | 73.3 ± 63.4 | 90.4 ± 92.6 | 0.138 |
|
|
||||
| Body mass index (kg/m2) | 23.6 ± 3.5 | 23.9 ± 3.6 | 23.4 ± 3.2 | 0.429 |
|
|
||||
| Weighted RTS* | 4.5 (1.5, 6.4) | 2.6 (0.0, 5.1) | 6.4 (5.1, 7.1) | < 0.001 |
|
|
||||
| Initial vital signs* | ||||
| 1. SBP (mmHg) | 61.5 (0.0, 83.8) | 52.0 (0.0, 75.0) | 79.0 (60.0, 95.0) | < 0.001 |
| 2. Heart rate (beats/min) | 98.5 (63.0, 121.8) | 92.0 (0.0, 120.0) | 104.0 (89.0, 123.0) | 0.002 |
| 3. Respiratory rate (breaths/min) | 19.0 (0.0, 24.0) | 12.0 (0.0, 23.0) | 21.0 (18.0, 24.0) | < 0.001 |
| 4. Body temperature (°C) | 36.0 (35.0, 36.3) | 35.8 (34.6, 36.1) | 36.1 (35.8, 36.3) | < 0.001 |
| 5. Glasgow Coma Scale | 6.0 (3.0, 13.0) | 3.0 (3.0, 9.0) | 13.0 (8.0, 15.0) | < 0.001 |
|
|
||||
| Injury severity score* | 34.0 (25.0, 43.0) | 34.0 (26.0, 43.0) | 29.0 (18.0, 43.0) | 0.087 |
|
|
||||
| Abbreviated trauma score | ||||
| 1. Head | 1.0 ± 1.6 | 0.9 ± 1.6 | 1.1 ± 1.6 | 0.570 |
| 2. Face | 0.3 ± 0.7 | 0.3 ± 0.6 | 0.4 ± 0.8 | 0.104 |
| 3. Chest | 2.2 ± 1.6 | 2.3 ± 1.6 | 2.0 ± 1.6 | 0.095 |
| 4. Abdomen | 3.0 ± 1.6 | 3.0 ± 1.7 | 3.0 ± 1.4 | 0.943 |
| 5. Extremities | 2.7 ± 2.1 | 2.8 ± 2.1 | 2.7 ± 2.0 | 0.813 |
| 6. Skin | 0.3 ± 0.5 | 0.4 ± 0.6 | 0.3 ± 0.4 | 0.168 |
|
|
||||
| Initial laboratories | ||||
| 1. pH | 7.2 ± 0.2 | 7.1 ± 0.2 | 7.3 ± 0.1 | < 0.001 |
| 2. PaO2 (mmHg) | 148.1 ± 114.3 | 137.1 ± 112.6 | 168.0 ± 115.3 | 0.054 |
| 3. PaCO2 (mmHg) | 40.7 ± 17.9 | 43.2 ± 20.9 | 36.2 ± 9.5 | 0.001 |
| 4. SaO2 (%) | 87.1 ± 22.7 | 82.7 ± 26.3 | 94.8 ± 10.9 | < 0.001 |
| 5. Base excess (mmol/L) | −12.3 ± 7.4 | −14.5 ± 7.3 | −8.6 ± 6.0 | < 0.001 |
| 6. Lactate (mmol/L) | 9.0 ± 4.5 | 10.6 ± 4.1 | 6.2 ± 3.8 | < 0.001 |
| 7. PT INR | 2.3 ± 3.6 | 2.7 ± 4.3 | 1.4 ± 1.3 | 0.001 |
| 8. Hemoglobin (g/dL) | 10.4 ± 2.7 | 10.0 ± 2.8 | 11.0 ± 2.5 | 0.006 |
Table 2
| Variables | Overall (n = 234) | In-hospital non-survivor (n = 153) | In-hospital survivor (n = 81) | p |
|---|---|---|---|---|
| Main injury, system (%) | ||||
| 1. Multi-system injuries | 91 (38.9) | 68 (44.4) | 23 (28.4) | 0.024 |
| 2. Abdominal injury | 82 (35.0) | 48 (31.4) | 34 (42.0) | 0.141 |
| 3. Pelvic injury | 48 (20.5) | 31 (20.3) | 17 (21.0) | 1 |
| 4. Lower extremities injury | 7 (3.0) | 2 (1.3) | 5 (6.2) | 0.05 |
| 5. oracic injury | 6 (2.6) | 4 (2.6) | 2 (2.5) | 1 |
|
|
||||
| Young & Burgess classification of pelvic fractures | ||||
| 1. Lateral compression | 67 (28.6) | 50 (32.7) | 17 (21.0) | 0.084 |
| 2. Anteroposterior compression | 33 (14.1) | 23 (15.0) | 10 (12.3) | 0.716 |
| 3. Vertical shear | 18 (7.7) | 12 (7.8) | 6 (7.4) | 1 |
|
|
||||
| Focused assessment with sonography for trauma | ||||
| 1. Abdomen (+) | 131 (56.0) | 82 (53.6) | 49 (60.5) | 0.383 |
| 2. Chest and abdomen (+) | 20 (8.5) | 17 (11.1) | 3 (3.7) | 0.092 |
| 3. Chest (+) | 10 (4.3) | 7 (4.6) | 3 (3.7) | 1 |
|
|
||||
| Vascular access method (%) | ||||
| 1. Seldinger method | 205 (87.6) | 130 (85.0) | 75 (92.6) | 0.140 |
| 2. US-guided | 23 (9.8) | 18 (11.8) | 5 (6.2) | 0.256 |
| 3. Open | 6 (2.6) | 5 (3.3) | 1 (1.2) | 0.667 |
|
|
||||
| Door to balloon time (min)* | 33.0 (22.0, 51.0) | 32.0 (21.5, 47.0) | 35.0 (22.0, 59.0) | 0.229 |
| REBOA final zone (%) | ||||
| 1. Zone I | 144 (61.5) | 94 (61.4) | 50 (61.7) | 1 |
| 2. Zone III | 86 (36.8) | 55 (35.9) | 31 (38.3) | 0.835 |
| 3. Zone II | 4 (1.7) | 4 (2.6) | 0 (0.0) | 0.301 |
|
|
||||
| Total occlusion time (min)* | 88.0 (52.0, 178.0) | 120.0 (60.0, 205.0) | 76.0 (42.0, 104.0) | < 0.001 |
|
|
||||
| SBP pre-REBOA (mmHg) | 51.7 ± 28.0 | 44.3 ± 28.3 | 65.7 ± 21.4 | < 0.001 |
|
|
||||
| SBP post-REBOA (mmHg) | 91.7 ± 40.3 | 81.1 ± 41.9 | 111.7 ± 28.1 | < 0.001 |
|
|
||||
| SBP gap after REBOA (mmHg) | 40.0 ± 31.4 | 36.9 ± 33.9 | 46.0 ± 25.4 | 0.022 |
|
|
||||
| REBOA brand name (%) | ||||
| 1. Rescue 7 | 187 (79.9) | 118 (77.1) | 69 (85.2) | 0.196 |
| 2. Reliant | 37 (15.8) | 28 (18.3) | 9 (11.1) | 0.213 |
| 3. Coda | 10 (4.3) | 7 (4.6) | 3 (3.7) | 1 |
Table 3
| Variables | Overall n ( = 234) | In-hospital non-survivor (n = 153) | In-hospital survivor (n = 81) | p |
|---|---|---|---|---|
| Pre-/in-hospital CPR (%) | 92 (39.3) | 88 (57.5) | 4 (4.9) | < 0.001 |
|
|
||||
| REBOA during CPR (%) | 39 (16.7) | 39 (25.5) | 0 (0.0) | < 0.001 |
|
|
||||
| Door to transfusion time (min)* | 17.0 (11.0, 24.0) | 16.0 (11.0, 25.0) | 17.0 (11.0, 24.0) | 0.592 |
|
|
||||
| 4-h transfusion* | ||||
| 1. RBC (unit) | 13.0 (9.0, 19.0) | 16.0 (10.0, 23.0) | 11.0 (9.0, 15.0) | < 0.001 |
| 2. FFP (unit) | 8.0 (4.0, 12.0) | 9.0 (4.0, 13.0) | 6.0 (4.0, 9.0) | 0.009 |
| 3. Platelets (unit) | 0.0 (0.0, 0.0) | 0.0 (0.0, 0.0) | 0.0 (0.0, 0.0) | 0.760 |
|
|
||||
| 24-h transfusion* | ||||
| 1. RBC (unit) | 20.0 (12.0, 33.8) | 22.0 (13.0, 39.0) | 15.0 (11.0, 24.0) | < 0.001 |
| 2. FFP (unit) | 13.0 (8.0, 24.8) | 16.0 (8.0, 28.0) | 12.0 (8.0, 18.0) | 0.056 |
| 3. Platelets (unit) | 0.0 (0.0, 10.0) | 0.0 (0.0, 9.0) | 8.0 (0.0, 10.0) | 0.006 |
|
|
||||
| Door to OP time (min)* | 70.0 (45.0, 106.0) | 71.0 (45.8, 106.0) | 68.0 (45.0, 109.0) | 0.925 |
|
|
||||
| Total OP time (min)* | 85.0 (52.0, 120.0) | 65.0 (41.0, 105.0) | 100.0 (81.5, 157.0) | < 0.001 |
|
|
||||
| EBL in OP (mL)* | 3,000 (1,500, 5,000) | 4,000 (2,000, 8,000) | 2,000 (1,500, 3,000) | < 0.001 |
|
|
||||
| Preperitoneal pelvic packing (%) | 73 (31.2) | 51 (33.3) | 22 (27.2) | 0.411 |
|
|
||||
| Angiographic intervention (%) | 98 (41.9) | 56 (36.6) | 42 (51.9) | 0.035 |
Table 4
| Variables | Overall (n = 234) | In-hospital non-survivor (n = 153) | In-hospital survivor (n = 81) | p |
|---|---|---|---|---|
| Responder (%) | 167 (71.4) | 96 (62.7) | 71 (87.7) | < 0.001 |
|
|
||||
| REBOA-related complication (%) | 22 (9.4) | 13 (8.5) | 9 (11.1) | 0.677 |
| 1. Injury or thrombosis of puncture vessel | 7 (3.0) | 2 (1.3) | 5 (6.2) | 0.050 |
| 2. Extremity or skin necrosis | 6 (2.6) | 3 (2.0) | 3 (3.7) | 0.419 |
| 3. Bowel ischemia | 4 (1.7) | 3 (2.0) | 1 (1.2) | 1 |
| 4. Unintended migration of balloon | 4 (1.7) | 4 (2.6) | 0 (0.0) | 0.301 |
| 5. Unintended insertion into vena cava | 2 (0.9) | 2 (1.3) | 0 (0.0) | 0.545 |
| 6. Embolization of catheter fragment | 1 (0.4) | 0 (0.0) | 1 (1.2) | 0.346 |
|
|
||||
| General complication (%) | 102 (43.6) | 52 (34.0) | 50 (61.7) | < 0.001 |
| 1. Acute kidney injury | 126 (53.8) | 93 (60.8) | 33 (40.7) | 0.005 |
| 2. Multiple organ dysfunction syndrome | 23 (9.8) | 23 (15.0) | 0 (0.0) | 0.001 |
| 3. Acute respiratory distress syndrome | 20 (8.5) | 11 (7.2) | 9 (11.1) | 0.438 |
| 4. Hospital-acquired pneumonia | 19 (8.1) | 7 (4.6) | 12 (14.8) | 0.013 |
|
|
||||
| AKI-RIFLE criteria (%) | ||||
| 1. Risk | 45 (25.4) | 30 (27.8) | 15 (21.7) | 0.470 |
| 2. Injury | 28 (15.8) | 21 (19.4) | 7 (10.1) | 0.149 |
| 3. Failure | 35 (19.2) | 24 (22.2) | 10 (14.5) | 0.281 |
| 4. Loss | 2 (1.1) | 1 (0.9) | 1 (1.4) | 1 |
| 5. End stage renal disease | 1 (0.6) | 0 (0.0) | 1 (1.4) | 0.390 |
|
|
||||
| CRRT (%) | 39 (16.7) | 29 (19.0) | 10 (12.3) | 0.269 |
|
|
||||
| Hospital stay (d)* | 2.0 (1.0, 32.8) | 1.0 (1.0, 2.0) | 41.0 (23.0, 71.0) | < 0.001 |
|
|
||||
| ICU stay (d)* | 2.0 (1.0, 10.0) | 1.0 (1.0, 2.0) | 10.0 (4.0, 18.0) | < 0.001 |
|
|
||||
| Mortality (%) | ||||
| 1. In-hospital mortality | 153 (65.4) | |||
| 2. 24-h mortality | 110 (47.0) | |||
| 3. 14-d mortality | 143 (61.1) | |||
|
|
||||
| Reason of death (%) | ||||
| 1. Hemorrhagic shock | 111 (72.5) | |||
| 2. Multiple organ dysfunction syndrome | 28 (18.3) | |||
| 3. Brain, neurogenic shock | 15 (9.8) | |||
| 4. Respiratory | 5 (3.3) | |||
| 5. Cardiovascular | 4 (2.6) | |||


